. 2012;7(6):e38773.
doi: 10.1371/journal.pone.0038773. Epub 2012 Jun 11.

TIMP-1 induces an EMT-like phenotypic conversion in MDCK cells independent of its MMP-inhibitory domain

Affiliations

TIMP-1 induces an EMT-like phenotypic conversion in MDCK cells independent of its MMP-inhibitory domain

Young Suk Jung et al. PLoS One. 2012.

Abstract

Matrix metalloproteinases (MMPs) and their endogenous inhibitors (TIMPs) regulate epithelial-mesenchymal transition (EMT) critical for the development of epithelial organs as well as cancer cell invasion. TIMP-1 is frequently overexpressed in several types of human cancers and serves as a prognostic marker. The present study investigates the roles of TIMP-1 on the EMT process and formation of the lumen-like structure in a 3D Matrigel culture of MDCK cells. We show that TIMP-1 overexpression effectively prevents cell polarization and acinar-like structure formation. TIMP-1 induces expression of the developmental EMT transcription factors such as SLUG, TWIST, ZEB1 and ZEB2, leading to downregulation of epithelial marker and upregulation of mesenchymal markers. Importantly, TIMP-1's ability to induce the EMT-like process is independent of its MMP-inhibitory domain. To our surprise, TIMP-1 induces migratory and invasive properties in MDCK cells. Here, we present a novel finding that TIMP-1 signaling upregulates MT1-MMP and MMP-2 expression, and potentiates MT1-MMP activation of pro-MMP-2, contributing to tumor cell invasion. In spite of the fact that TIMP-1, as opposed to TIMP-2, does not interact with and inhibit MT1-MMP, TIMP-1 may act as a key regulator of MT1-MMP/MMP-2 axis. Collectively, our findings suggest a model in which TIMP-1 functions as a signaling molecule and also as an endogenous inhibitor of MMPs. This concept represents a paradigm shift in the current view of TIMP-1/MT1-MMP interactions and functions during cancer development/progression.


Conflict of interest statement

Competing Interests: The authors have declared that no competing interests exist.

Figures

Figure 1
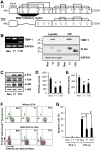
Figure 1. TIMP-1 induces cell survival signaling in MDCK cells, independent of its MMP-inhibitory domain. A.
Schematic representation of the T1 and T1D proteins. The 12 cysteine (C) residues are linked to form six disulfide bonds; the 23 amino acids-long secretion signal sequence (amino acid 1–23) is indicated. A TIMP-1 mutant encoding the C-terminal and partial N-terminal (amino acid 66–184) regions of human T1 is indicated as TID. B. (Left Panel) RT-PCR analysis of TIMP-1 mRNA in MDCK-Neo, MDCK-T1 and MDCK-T1D cells using primers common to human and canine TIMP-1 mRNA. B. (Right Panel) Immunoblot analysis of TIMP-1 in cell lysates or conditioned media (CM) using anti-TIMP-1 Ab that recognizes the N-terminal domain of TIMP-1 (top panel) or anti-FLAG antibody (middle panel). C. Immunoblot analysis of Erk and Akt using MDCK-Neo, -T1, and –T1D cell lysates. D-E. DEVDase activity in MDCK-Neo, MDCK-T1, and MDCK-T1D cells upon treatment with 0.5 uM staurosporine for 4 hr (D) and serum-free culturing for 48 hr (E). DEVDase activity was normalized per microgram protein and each bar represents the mean ± s.d. of triplicates in three independent experiments. F-G. Apoptotic cells were quantified by FACS after F2N12S labeling and SYTOX AADvanced™ dead cell stain. (F) Representative FACS data without or with 0.5 µM staurosporine for 16 hr. (Upper left-dead cells; Lower left-apoptotic cells; Lower right-live cells). (G) Bar graph represents the mean percentages of apoptotic cells ± s.d. in the three independent experiment. Asterisk (*) indicates a P value <0.001 using a Paired T-test.
Figure 2
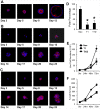
Figure 2. TIMP-1 signaling disrupts MDCK cell polarization and acini formation in a 3D Matrigel culture.
Phalloidin staining (red) and blue-fluorescent nuclear staining with DAPI in MDCK-Neo (A), -T1 (B), and –T1D (C) cells in a 3D Matrigel culture for indicated periods. D. Percentage of polarized acini examined in cross sections through the middle of developing acini of MDCK-Neo at 12 days, and T1, T1D at 23 days. (More than 40 spheroids were analyzed for each condition from three independent experiments and the means + s.d. were shown). E-F. At the indicated time points, MDCK-Neo, T1, T1D cell proliferation was assessed by trypan blue exclusion assay (E) or MTT assay (F). (Shown are means + s.d of three independent experiments).
Figure 3
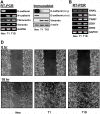
Figure 3. TIMP-1 regulates EMT markers and induces motility of MDCK cells, independent of its MMP-inhibitory domain. A.
RT-PCR analysis (left panel) of epithelial marker E-cadherin and mesenchymal markers N-cadherin, Fibronectin, and Vimentin. Immunoblot analysis (right panel) of E-cadherin (after long and short exposures) and vimentin in MDCK-Neo, -T1, and –T1D cells. B. RT-PCR analysis of EMT transcriptional factors SNAIL, SLUG, TWIST, ZEB1 and ZEB2. C. A scratch migration assay was performed in MDCK-Neo, -T1 and T1D cells for 18 h.
Figure 4
Figure 4. TIMP-1, but not GM6001 treatment, enhances MDCK cell migration and invasion. A.
MDCK-Neo, -T1, and –T1D cells were incubated with 25 µM GM6001 and cell lysates were collected at the indicated time points, followed by immunoblotting analysis for Akt and ERKs. B. Cell migration was determined using a Transwell chamber assay for 18 h. The total number of cells that migrated to the lower side of the filter were counted using microscopy at 100X. C. Cell invasion was assessed using a BioCoat Matrigel Invasion Chamber for 16 h. The total number of cells that invaded to the lower side of the filter were counted using microscopy at 100X. The experiment was done in triplicates and the data is representative of three independent experiments. Each bar represents the mean ± s.d. Means with different letters (a, b, c) are significantly different from one another at P value <0.05 (ANOVA followed by Newman-Keuls test) and asterisk (*) indicates a P value <0.01 using a paired T-test.
Figure 5
Figure 5. TIMP-1, independent of its MMP-inhibitory domain, upregulates the MT1-MMP/MMP-2 axis in MDCK cells.
MDCK-Neo, -T1, and T1D cells were untreated (-) or treated (+) with ConA for 18 hr. A. MT1-MMP, MMP-2, and MMP-9 RNA levels were determined by semi-quantitative RT-PCR. B. Cell lysates and conditioned media were resolved by reducing 10% SDS-PAGE followed by immunoblot analysis of MT1-MMP and MMP-2. C. Conditioned media were analyzed by gelatin zymography. P, pro-MMP-2: I, intermediate form of MMP-2: A, active MMP-2.
Figure 6
Figure 6. Knockdown of MT1-MMP abrogated MMP-2 activation in the MDCK-T1, T1D cells.
MDCK-T1 (A) and MDCK-T1D (B) cells in the absence or presence of control or MT1-MMP siRNAs were untreated (-) or treated (+) with ConA for 18 hr. The protein levels of MT1-MMP in cell lysates and MMP-2 in conditioned media were determined by immunoblot analysis. Conditioned media were analyzed by gelatin zymography. P, pro-MMP-2: I, intermediate form of MMP-2: A, active MMP-2.
Figure 7
Figure 7. A working model of TIMP-1 regulation of cell survival and MT1-MMP/MMP2 axis during EMT.
TIMP-1 interacts with cell surface protein(s) via its C-terminal domain, resulting in activation of cell survival signaling pathways and regulation of gene expression. Increased MT1-MMP expression on the cell surface promotes MMP-2 activation. The pro-MMP-9 protein can interact with the C-terminal domain of TIMP-1, and thereby may reduce TIMP-1′s signaling capacity. TIMP-1 signaling-mediated downregulation of MMP-9 expression allows TIMP-1, free of pro-MMP-9, to further promote cell signaling, a positive feedback signal amplification.

References

    1. Vainio S, Muller U. Inductive tissue interactions, cell signaling, and the control of kidney organogenesis. Cell. 1997;90:978. - PubMed
    1. Sakurai H, Barros EJ, Tsukamoto T, Barasch J, Nigam SK. An in vitro tubulogenesis system using cell lines derived from the embryonic kidney shows dependence on multiple soluble growth factors. Proc Natl Acad Sci U S A. 1997;94:6284. - PMC - PubMed
    1. Gumbiner BM. Epithelial morphogenesis. Cell. 1992;69:387. - PubMed
    1. Thiery JP. Epithelial-mesenchymal transitions in tumour progression. Nat Rev Cancer. 2002;2:454. - PubMed
    1. Leighton J, Estes LW, Mansukhani S, Brada Z. A cell line derived from normal dog kidney (MDCK) exhibiting qualities of papillary adenocarcinoma and of renal tubular epithelium. Cancer. 1970;26:1028. - PubMed

Publication types

MeSH terms