. 2012 Oct;11(5):794-800.
doi: 10.1111/j.1474-9726.2012.00846.x. Epub 2012 Jul 12.

Deviation of innate circadian period from 24 h reduces longevity in mice

Affiliations

Deviation of innate circadian period from 24 h reduces longevity in mice

Sergiy Libert et al. Aging Cell. 2012 Oct.

Abstract

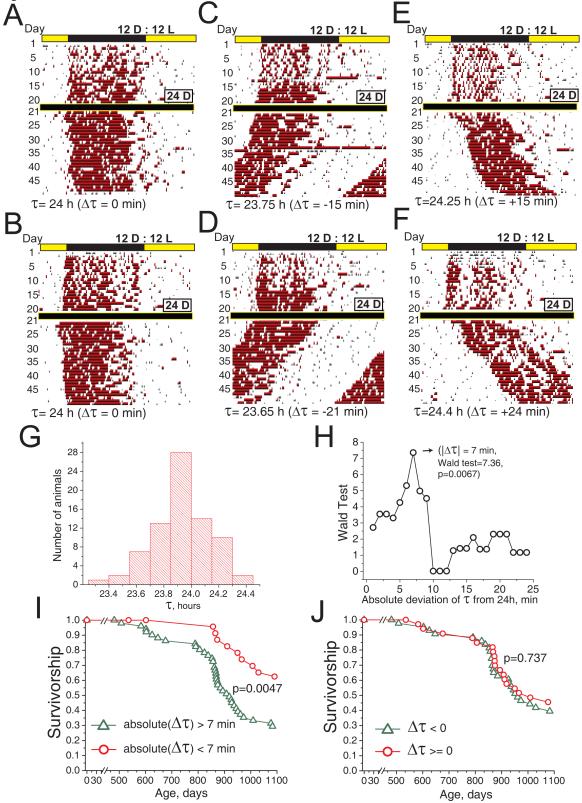
The variation of individual life spans, even in highly inbred cohorts of animals and under strictly controlled environmental conditions, is substantial and not well understood. This variation in part could be due to epigenetic variation, which later affects the animal's physiology and ultimately longevity. Identification of the physiological properties that impact health and life span is crucial for longevity research and the development of anti-aging therapies. Here, we measured individual circadian and metabolic characteristics in a cohort of inbred F1 hybrid mice and correlated these parameters to their life spans. We found that mice with innate circadian periods close to 24 h (revealed during 30 days of housing in total darkness) enjoyed nearly 20% longer life spans than their littermates, which had shorter or longer innate circadian periods. These findings show that maintenance of a 24-h intrinsic circadian period is a positive predictor of longevity. Our data suggest that circadian period may be used to predict individual longevity and that processes that control innate circadian period affect aging.


Figures

Figure 1
Figure 1
Mice with innate circadian rhythm close to 24 hours have reduced mortality. (A-F) Typical actograms of animal’s activity are shown (each panel represents one animal). Running activity of each animal was binned in 10 minute intervals and plotted against the time of the day (one line represents 24 hours) for 50 consecutive days. Red bars indicate continuous running activity for at least 20 minutes with an average speed greater than 2 feet per minute. A-B) Typical actograms of animals with innate circadian period of 24 hours. C-D) Typical actograms of animals with innate circadian period shorter than 24 hours. E-F) Typical actograms of animals with innate circadian period longer than 24 hours. G) The histogram of the distribution of the innate circadian period for the tested cohort of mice is shown. The distribution has symmetrical bell-like shape. H) Deviation of the innate circadian period (Τ) by more than 7 minutes negatively impacts longevity of animals. Absolute deviation of the innate period (ΔΤ) was assigned to each animal. Animals were grouped into two categories, those with ΔΤ less than particular cutoff value and those with ΔΤ greater than that value. Statistical significance (using Wald test) of survival difference between these two groups of animals is plotted against ΔΤ cutoff values ranging from 1 to 24 minutes. ΔΤ of 7 minutes yields the maximum difference in survivorship. I) Animals with innate circadian rhythm close to 24 hours (+/− 7 minutes, red survivorship curve, N=24) enjoy longer lifespan (p=0.0047) than animals with circadian rhythm significantly longer or shorter than 24 hours (greater deviation than 7 minutes, green curve, N=52, see also Supplementary Figure 1 and Supplementary Table 1). J) Longevity of animals with longer versus shorter circadian rhythm does not differ. Survival curves for two groups are shown. Nred=33 (animals with circadian periods greater than or equal to 24 hours), Ngreen=43 (animals with circadian periods less than 24 hours), p=0.737.
Figure 2
Figure 2
Innate circadian rhythm correlates with certain physical parameters of individual animals. A) Higher weight of animals correlates with longer innate circadian period (Τ). Scatter plot for individual animals is shown. Weight of animals is plotted against deviation of innate circadian rhythm from 24 hours (ΔΤ). Linear regression (R=0.27, p=0.018) reveals weak positive correlation between weight and Τ. B) Animals with innate circadian period Τ greater than 24 hours on average weigh 8% more than animals with Τ less than 24 hours (p=0.0004). C) The table presents the summary of correlations between individual’s weight, physical activity, glucose levels, metabolic rate, and glucose handling with their innate circadian period. Weight has positive correlation Τ (also see A-B), physical activity and metabolic rate have negative correlation with Τ, and glucose handling parameters do not show any correlation.
Figure 3
Figure 3
Voluntary physical activity correlates with metabolic rate. A) Fasted glucose levels do not correlate with longevity. We separated all the animals into three groups, according to their levels of blood glucose: high (125-190 mg/dL), medium (110-125 mg/dL), and low (60-109 mg/dL). Average longevity for these three groups is shown (+/− SEM). See also Supplementary Figure 2 for statistical analysis via Cox proportional hazard model. B) Glucose tolerance does not correlate with longevity. We separated all the animals into three groups, according to their ability to absorb glucose in glucose tolerance test (GTT) as measured by the calculated area under the curve. Groups of animals with high area under the GTT curve (1150-1600 mmol/L/120 min), medium (1000-1150 mmol/L/120 min), and low (500-1000 mmol/L/120 min) were identified. Average longevity for these three groups is shown (+/− SEM). There are no statistically significant differences via t-test for all the possible pair-wise combinations or ANOVA (p=0.62). See also Supplementary Figure 2 for statistical analysis via Cox proportional hazard model. C) Body weight of the animals does not strongly correlate with their lifespan. Median body weight of animals in our cohort was 44 grams (body weight was measured at 1 year of age after overnight fasting). Survival curves for two halves are shown. Open circles represent lighter half of the cohort (body weight <44 g, N=38), and filled triangles represent heavier half of the cohort (body weight >44 g, N=38). There is no statistically significant difference in survival between these two groups (p =0.441). D) Animals with low voluntary physical activity tend to have shorter lifespans. We separated all the animals into three groups, according to their free-running activity: highly active individuals travelled from 1.25 to 3.25 kilometers per day, individuals with moderate activity from 500 to 1250 meters per day, and low activity from 0 to 500 meters per day. Animals with higher activity had on average longer lifespans (p=0.041). However, Cox proportional hazard analysis did not reveal linear relation between physical activity and longevity (see also Supplementary Figure 2). E) Animals with higher metabolic rate (as measured by calories consumed per gram of body weight per day) tend to have longer lifespans (p=0.030). We separated all the animals into three groups, according to their metabolic rate. Individuals with high metabolic rate (those that consumed from 0.47 to 0.6 kilocalories per gram of body weight per day), moderate metabolic rate (0.42-0.47), and low metabolic rate (0.37-0.42). Average longevity for these three groups is shown (+/− SEM). Animals with high metabolic rate had on average greater longevity then moderate or low metabolic rate animals. However, Cox proportional hazard analysis did not reveal a linear relation between metabolic rate and longevity (see also Supplementary Figure 2). F) There is a strong correlation between voluntary physical activity and metabolic rate. Individuals with higher relative metabolic rate also tend to be the individuals with higher voluntary physical activity (p=2.9*10−4). Scatter plot for these two values is shown. Each point represents an individual animal. This correlation shows that longevity increases shown on panels (D) and (E) are linked.

Similar articles

Cited by

References

    1. Andrikopoulos S, Blair AR, Deluca N, Fam BC, Proietto J. Evaluating the glucose tolerance test in mice. Am J Physiol Endocrinol Metab. 2008;295:E1323–1332. - PubMed
    1. Anisimov VN, Zavarzina NY, Zabezhinski MA, Popovich IG, Zimina OA, Shtylick AV, Arutjunyan AV, Oparina TI, Prokopenko VM, Mikhalski AI, et al. Melatonin increases both life span and tumor incidence in female CBA mice. J Gerontol A Biol Sci Med Sci. 2001;56:B311–323. - PubMed
    1. Bartke A. Delayed aging in Ames dwarf mice. Relationships to endocrine function and body size. Results Probl Cell Differ. 2000;29:181–202. - PubMed
    1. Bartke A. Growth hormone, insulin and aging: the benefits of endocrine defects. Exp Gerontol. 2011;46:108–111. - PMC - PubMed
    1. Bass J, Takahashi JS. Circadian integration of metabolism and energetics. Science. 2010;330:1349–1354. - PMC - PubMed

Publication types