. 2012 Jun 15:13:241.
doi: 10.1186/1471-2164-13-241.

Identification and validation of copy number variants using SNP genotyping arrays from a large clinical cohort

Affiliations

Identification and validation of copy number variants using SNP genotyping arrays from a large clinical cohort

Armand Valsesia et al. BMC Genomics. .

Abstract

Background: Genotypes obtained with commercial SNP arrays have been extensively used in many large case-control or population-based cohorts for SNP-based genome-wide association studies for a multitude of traits. Yet, these genotypes capture only a small fraction of the variance of the studied traits. Genomic structural variants (GSV) such as Copy Number Variation (CNV) may account for part of the missing heritability, but their comprehensive detection requires either next-generation arrays or sequencing. Sophisticated algorithms that infer CNVs by combining the intensities from SNP-probes for the two alleles can already be used to extract a partial view of such GSV from existing data sets.

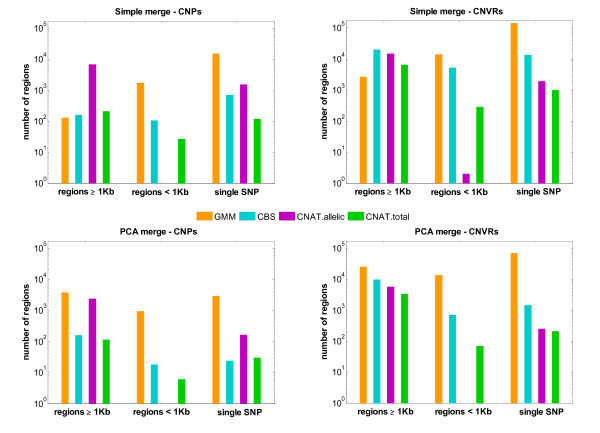
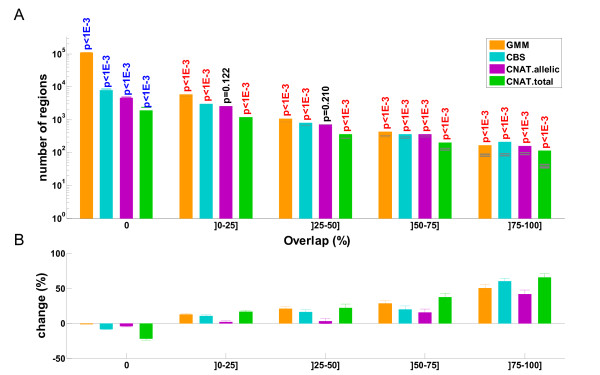
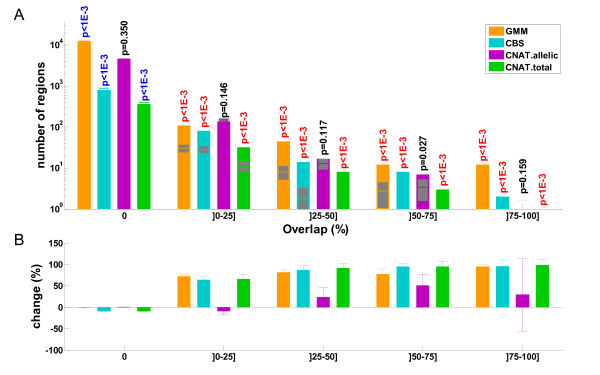
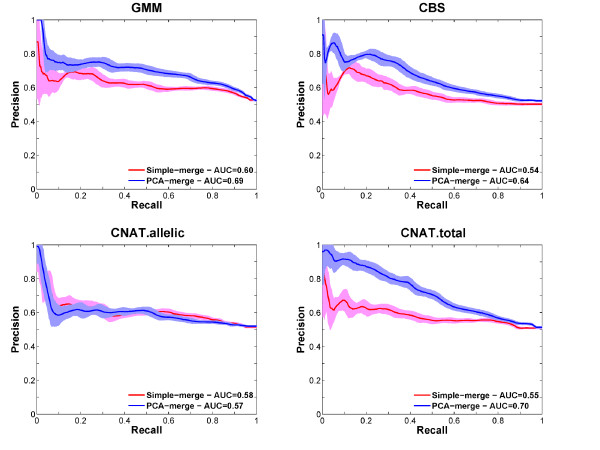
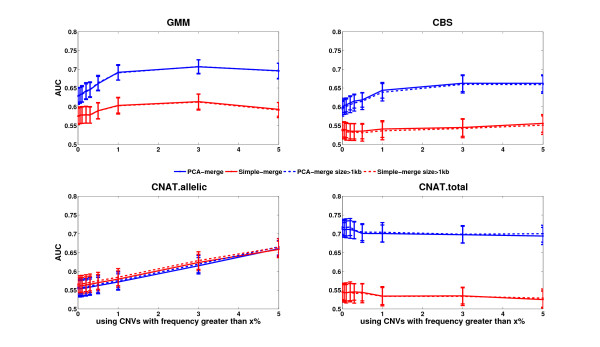
Results: Here we present several advances to facilitate the latter approach. First, we introduce a novel CNV detection method based on a Gaussian Mixture Model. Second, we propose a new algorithm, PCA merge, for combining copy-number profiles from many individuals into consensus regions. We applied both our new methods as well as existing ones to data from 5612 individuals from the CoLaus study who were genotyped on Affymetrix 500K arrays. We developed a number of procedures in order to evaluate the performance of the different methods. This includes comparison with previously published CNVs as well as using a replication sample of 239 individuals, genotyped with Illumina 550K arrays. We also established a new evaluation procedure that employs the fact that related individuals are expected to share their CNVs more frequently than randomly selected individuals. The ability to detect both rare and common CNVs provides a valuable resource that will facilitate association studies exploring potential phenotypic associations with CNVs.

Conclusion: Our new methodologies for CNV detection and their evaluation will help in extracting additional information from the large amount of SNP-genotyping data on various cohorts and use this to explore structural variants and their impact on complex traits.


Figures

Figure 1
Figure 1
Counts of CNVs identified with the different methods. Copy number variants (CNVs) were detected with four different algorithms (see legend) using data generated by Affymetrix 500K SNP arrays for the Cohorte Lausanne (n ≈ 5600). Adjacent SNPs with similar Copy Number profiles were merged into CNV regions using two different approaches: one based on principal component analysis (PCA, bottom panel) and a more simple approach that only merges SNPs with identical profiles (top panel). Copy number polymorphisms (CNPs, i.e. CNVs with population frequency above 1%) are shown on the left. Copy number variant regions (CNVRs, i.e. CNVs with population frequency below 1% but seen for at least five individuals) are shown on the right. In each plot, CNV counts are segregated according to their size.
Figure 2
Figure 2
Overlap between CNVs identified from CoLaus and published CNVs. A) Counts of CNVs with different methods (see legend) are segregated according to their overlap with CNVs published in the Database of Genomic Variants. Overlap is measured by the Jaccard coefficient, i.e. the ratio between the intersection and the union of two groups of CNVs. Expected counts from (1000 times) reshuffled data are shown in gray (extending over one standard deviation). Estimated p-values are indicated for significant enrichment (red) or depletion (blue), with respect to these controls. Non significant p-values (α > 1%) are shown in black. B) Percentage of changes between observed and expected counts from A. Error bars indicate +/- one standard deviation.
Figure 3
Figure 3
Overlap between CNVs identified from Affymetrix and Illumina data. A) Counts of CNVs identified with different methods (see legend) from Affymetrix data are segregated according to their overlap with CNVs identified from Illumina data. The Illumina panel includes a subset of 239 CoLaus individuals. Affymetrix-based CNVs, which did not include at least one individual from the Illumina panel, were excluded from the analysis. Overlap is measured by the Jaccard coefficient, i.e. the ratio between the intersection and the union of two groups of CNVs. Expected counts from (1000 times) reshuffled data are shown in gray (extending over one standard deviation). Estimated p-values are indicated for significant enrichment (red) or depletion (blue), with respect to these controls. Non significant p-values (α > 1%) are shown in black. B) Percentage of changes between observed and expected counts from A. Error bars indicate +/- one standard deviation.
Figure 4
Figure 4
Performance for predicting relatedness based on CNP profiles generated by different methods. Each plot shows the Receiver Operator Characteristic (ROC) curve for predicting relatedness between individuals based on the similarity of their CNV profiles generated by different methods (CNV detection algorithms are indicated above each plot and merging procedures by colors). The analysis employed 162 pairs of individuals known to be related and 2000 pairs of unrelated individuals. Curves were made with the mean (solid lines) +/- one standard deviation (light blue or light red surfaces) from 100 permutations. The Precision-Recall Area Under the Curve (AUC) values are shown in the legends.
Figure 5
Figure 5
Performance for predicting relatedness based on CNV profiles generated by different methods. Each plot shows the Precision-Recall Area Under the Curve (AUC) (Y axis) for predicting relatedness between individuals as a function of CNV frequency (X axis). CNV detection algorithms are indicated on top and merging procedure by colors. Predictions made with all CNV regions irrespective of their length are shown as straight lines and predictions using only CNV regions with length greater than 1 kb are represented with dashed line (both solid and dash lines overlap each other). Curves were made with the mean from n = 100 permutations, +/- one standard deviation around the mean is shown by the thickness of the square points. The analysis employed 162 pairs of individuals known to be related and 162 pairs of unrelated individuals.

References

    1. Iafrate AJ, Feuk L, Rivera MN, Listewnik ML, Donahoe PK, Qi Y, Scherer SW, Lee C. Detection of large-scale variation in the human genome. Nat Genet. 2004;36:949–951. - PubMed
    1. Feuk L, Carson AR, Scherer SW. Structural variation in the human genome. Nat Rev Genet. 2006;7:85–97. - PubMed
    1. Redon R, Ishikawa S, Fitch KR, Feuk L, Perry GH, Andrews TD, Fiegler H, Shapero MH, Carson AR, Chen W. et al.Global variation in copy number in the human genome. Nature. 2006;444:444–454. - PMC - PubMed
    1. Tuzun E, Sharp AJ, Bailey JA, Kaul R, Morrison VA, Pertz LM, Haugen E, Hayden H, Albertson D, Pinkel D. et al.Fine-scale structural variation of the human genome. Nat Genet. 2005;37:727–732. - PubMed
    1. Sharp AJ, Locke DP, McGrath SD, Cheng Z, Bailey JA, Vallente RU, Pertz LM, Clark RA, Schwartz S, Segraves R. et al.Segmental duplications and copy-number variation in the human genome. Am J Hum Genet. 2005;77:78–88. - PMC - PubMed

Publication types

LinkOut - more resources