. 2012 Jun 15:13:245.
doi: 10.1186/1471-2164-13-245.

Detection of horizontal transfer of individual genes by anomalous oligomer frequencies

Affiliations

Detection of horizontal transfer of individual genes by anomalous oligomer frequencies

Jeff Elhai et al. BMC Genomics. .

Abstract

Background: Understanding the history of life requires that we understand the transfer of genetic material across phylogenetic boundaries. Detecting genes that were acquired by means other than vertical descent is a basic step in that process. Detection by discordant phylogenies is computationally expensive and not always definitive. Many have used easily computed compositional features as an alternative procedure. However, different compositional methods produce different predictions, and the effectiveness of any method is not well established.

Results: The ability of octamer frequency comparisons to detect genes artificially seeded in cyanobacterial genomes was markedly increased by using as a training set those genes that are highly conserved over all bacteria. Using a subset of octamer frequencies in such tests also increased effectiveness, but this depended on the specific target genome and the source of the contaminating genes. The presence of high frequency octamers and the GC content of the contaminating genes were important considerations. A method comprising best practices from these tests was devised, the Core Gene Similarity (CGS) method, and it performed better than simple octamer frequency analysis, codon bias, or GC contrasts in detecting seeded genes or naturally occurring transposons. From a comparison of predictions with phylogenetic trees, it appears that the effectiveness of the method is confined to horizontal transfer events that have occurred recently in evolutionary time.

Conclusions: The CGS method may be an improvement over existing surrogate methods to detect genes of foreign origin.


Figures

Figure 1
Figure 1
Characteristics of genomes used in this study. (A) The phylogenetic tree was inferred from 16 S rRNA gene sequences using a Bayesian approach as described in the Methods section. The posterior probabilities are indicated at the nodes when equal to or greater than 80%. The length of the thick line at the bottom represents 0.1 mutations per position. The tree shown is substantially the same as that derived from other methods (Additional file 1). The shading highlights the well isolated clade of small marine Prochlorococcus and Synechococcus (Group 2). At the end of each leaf is the nickname of the organism used in this study. 3-letter nicknames are those used by KEGG. (B) Other characteristics of the genome. HIP1 frequency is given as the number of GCGATCGC sequences per 1 million nucleotides of genome sequence. The transposase (Tn) frequency is given as the number of annotated transposase genes per 1 million nucleotides of genome sequence. The source of the genome sequence is NCBI, with the given accession number, unless otherwise specified. The other sources are Kazusa DNA Research Institute, Joint Genome Institute (JGI), and the J. Craig Venter Institute. Published sources, when available, are given in references [27-40]. n.d. = not determined.
Figure 2
Figure 2
Distribution of gene scores according to four methods. Coding genes of Syn contaminated with 114 genes (3% of the total number of coding genes of Syn) from Tel were used. The z-score is the deviation of a score of a gene from the mean score, in units of standard deviations. Z-scores were binned every 0.25 units. For the two scoring methods (W8 and CGS) that use covariance, the signs of the Z scores were reversed so that putative foreign genes would lie on the right side of the graph (see Methods). The thick lines, thin lines, and dashed lines show the distributions of scores for all coding genes, test core genes, and introduced foreign genes, respectively. The right-most arrow identifies the z-score that splits the test core gene distribution into a ratio of 95:5. The left-most arrow identifies the z-score that maximizes the difference between the number of scores of introduced genes and number of scores of test core genes to the right of the arrow, a score that occurs at the intersection of the two curves. The shaded area is the maximal discrimination, i.e., the area under the dashed line minus the area under the thin line (the number of true positives minus the number of false positives) using the threshold marked by the left-most arrow. (A) GC, (B) Codon bias, (C) W8, (D) CGS.
Figure 3
Figure 3
Degradation of maximal discrimination by increasing contamination of a genome with foreign DNA. The genome of Syn was contaminated with genes from either Pmm (solid symbols) or Tel (hollow symbols), measuring maximal discrimination either by W8 (□,■), codon bias (◊,♦), or GC% (∆,▲). Maximal discrimination measured by CGS is not shown because its reference set (hence its calculated scores) is not affected by contaminating foreign genes.
Figure 4
Figure 4
Influence on maximal discrimination by choice of oligonucleotides used by W8 method. The W8 method normally uses all octanucleotide frequencies in its reference set. Here, the method was modified so that only the n% octanucleotides with the lowest frequencies were used, where n varied from 10 to 100. In all cases, the target genome was contaminated to a level of 3% by foreign genes. (A) A HIP1-rich genome (that of Syn; 47.4% GC, 855 HIP1/million nt) was contaminated with genes from a HIP1-rich genome (from Tel; 53.9% GC, 1418 HIP1/million nt). The bars show standard deviations from repetitions with three different sets of contaminating genes. (B) A low-GC, HIP1-poor (36.4% GC, 2 HIP1/million nt) genome (Pma) was contaminated with genes from the HIP1-poor genomes of either Pmt (♦; 50.7 GC%, 39 HIP1/million nt) or Cel (■; 35.4 GC%, 5 HIP1/million nt). A high-GC, HIP1-poor genome (Gvi; ▲; 62.0% GC, 68 HIP1/million nt) or HIP1-rich genome (Tel; ×; 53.9% ?GC, 1418 HIP1/million nt) was contaminated with high-GC genes from Syw (59.4% GC, 64 HIP1/million nt). The inset shows at the same scale the spike near 100% usage of the reference set with Tel as the target genome.
Figure 5
Figure 5
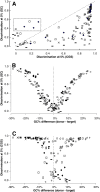
Comparison of CGS and GC methods. (A) Discrimination values based on CGS scores and GC scores were calculated using as targets the genomes of Group 1 cyanobacteria (□) Ana, (∆) Mar, and (○) Syn; of Group 2 cyanobacteria (+) Pma, (-) Pmt, and (×) Syw; and of (♦) Tel, contaminating them to a level of 3% with the same genes from up to 25 different organisms. Each point is the average of three trials. The values in the dotted box uses contaminating genes from (-) Gvi (GC% of 62%), (♦) Gvi, Syw (GC% of 59%), and Cya (GC% of 60%), (□) Pmm (GC% of 31%). (B) The same GC scores as in panel A are shown related to the difference in GC% of the donor and target genomes. (C) The same discrimination values as in panel A are shown related to the difference in GC% of the donor and target genomes. The identities of the genomes and values of both methods are provided in Additional file 2.
Figure 6
Figure 6
Comparison of effectiveness of CGS method vs other methods. Discrimination values determined by CGS, codon bias, W8, and modified W8 were calculated using as targets the genomes of Group 1 cyanobacteria (□) Ana, (∆) Cwat, () Mar, (○) Syn, and (◊) Ter; of Group 2 cyanobacteria (+) Pma, (-) Pmt, and (×) Syw; and of (♦) Tel, contaminating them to a level of 3% with the same genes from up to 25 different organisms. (A) Comparison with Codon Bias (CB). The values in the dotted box were obtained from cases in which contaminating genes were drawn from Gvi (GC% of 62%), Syw (GC% of 59%), and Cya (GC% of 60%). (B) Comparison with W8. The values in the dotted box were obtained from cases in which contaminating genes were drawn from from Gvi (GC% of 62%) and Syw (GC% of 59%). (C) Comparison with the W8 method modified to exclude contaminating genes. The W8 was modified so that genes artificially added to a genome did not contribute to the calculation of the reference set of octamer frequencies. The identities of the genomes and values for all methods are provided in Additional file 2.
Figure 7
Figure 7
Detection of transposases by different methods compared to CGS. Transposases from the 15 cyanobacterial genomes considered in this study with annotated transposases were predicted to be of foreign origin if their scores went beyond the threshold that excluded all but 5% of the test-native set. The fraction of transposases found for a given organism by the CGS method was compared to the same fraction found by the W8 (□), codon bias (∆), and GC (◊) methods. The area of the symbol is proportional to the fraction of the genome attributable to transposases (Additional file 9).
Figure 8
Figure 8
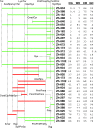
Predicted time ranges of horizontal transfer events. Evolutionary time ranges symbolized by horizontal lines are shown during which horizontal gene transfer events may have occurred to explain the phylogenetic trees provided in Additional file 10. Each line is associated with a set of proteins reported by Zhaxybayeva et al. [42] to contain at least one conflict with the 16 S rRNA gene tree. The termini of the time ranges are defined by evolutionary events deduced from the 16 S rRNA gene tree (Figure  1), either the divergence of a single organism (represented by the symbol of that organism) from many or the divergence of one or two organisms from one or two other organisms (represented by the diverging organisms symbols separated by a slash). Evolutionary time proceeds left to right, roughly proportional to the number of mutations that have accumulated in ribosomal DNA. The scores of the gene or genes (averaged) predicted to have resulted from horizontal gene transfer are given at the right, according to the four methods considered. Green lines indicate time periods that are at least partially as recent as the divergence of Pmf/Pmt from Synechococcus.
Figure 9
Figure 9
Function of genes identified as putative foreign. The distribution of genes in seven representative cyanobacteria is shown, in each case dividing the genes into two classes: those with CGS scores < 5 (top row) and those with scores ≥ 5 (bottom row). The circle represents all genes of the class.
Figure 10
Figure 10
Evolutionary context of genes as related to CGS scores. The proteins encoded by the chromosome (A) or five plasmids (B) of Synechocystis PCC 6803 were ordered by their CGS scores and divided into four categories: cyanobacterial, non-cyanobacterial, recent origin, and solitary, as described in the text and Methods. Each point on the graph is a frequency based on 50 proteins centered around the CGS ranking. The blue shaded areas indicate genes with CGS scores < 0.05.

Similar articles

Cited by

References

    1. Koonin EV, Wolf YI. Genomics of bacteria and archaea: the emerging dynamic view of the prokaryotic world. Nucleic Acids Res. 2008;36:6688–6719. doi: 10.1093/nar/gkn668. - DOI - PMC - PubMed
    1. Nakamura Y, Itoh T, Matsuda H, Gojobori T. Biased biological functions of horizontally transferred genes in prokaryotic genomes. Nat Genet. 2004;36:760–766. doi: 10.1038/ng1381. - DOI - PubMed
    1. Ragan MA, Beiko RG. Lateral genetic transfer: open issues. Phil Trans R Soc B. 2009;364:2241–2251. doi: 10.1098/rstb.2009.0031. - DOI - PMC - PubMed
    1. Doolittle WF. Eradicating typological thinking in prokaryotic systematics and evolution. Cold Spring Harbor Symp Quant Biol. 2009;74:197–204. doi: 10.1101/sqb.2009.74.002. - DOI - PubMed
    1. Syvanen M. Horizontal gene transfer: evidence and possible consequences. Annu Rev Genet. 1994;28:237–261. doi: 10.1146/annurev.ge.28.120194.001321. - DOI - PubMed

Publication types

Substances