. 2012 Jun 15;2(1):13.
doi: 10.1186/2044-5040-2-13.

Satellite cell heterogeneity revealed by G-Tool, an open algorithm to quantify myogenesis through colony-forming assays

Affiliations

Satellite cell heterogeneity revealed by G-Tool, an open algorithm to quantify myogenesis through colony-forming assays

Joseph Ippolito et al. Skelet Muscle. .

Abstract

Background: Muscle growth and repair is accomplished by the satellite cell pool, a self-renewing population of myogenic progenitors. Functional heterogeneity within the satellite cell compartment and changes in potential with experimental intervention can be revealed by in vitro colony-forming cell (CFC) assays, however large numbers of colonies need to be assayed to give meaningful data, and manually quantifying nuclei and scoring markers of differentiation is experimentally limiting.

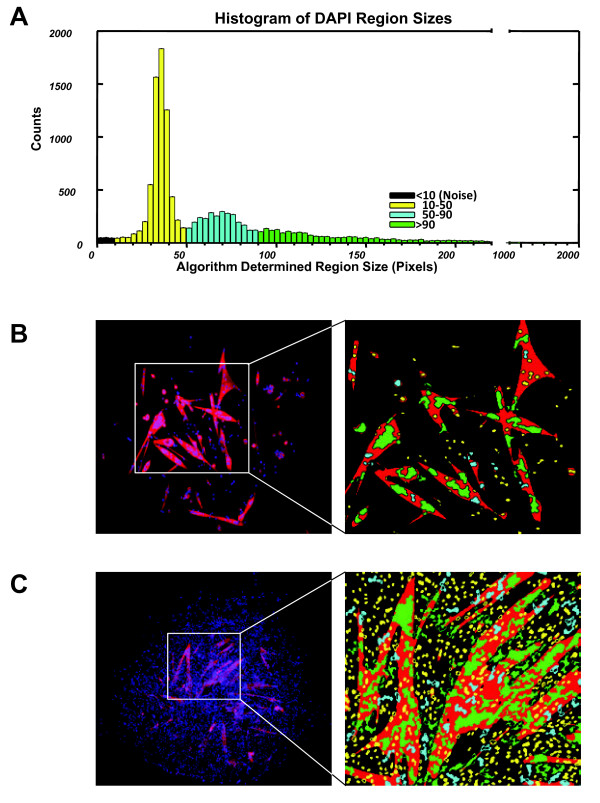
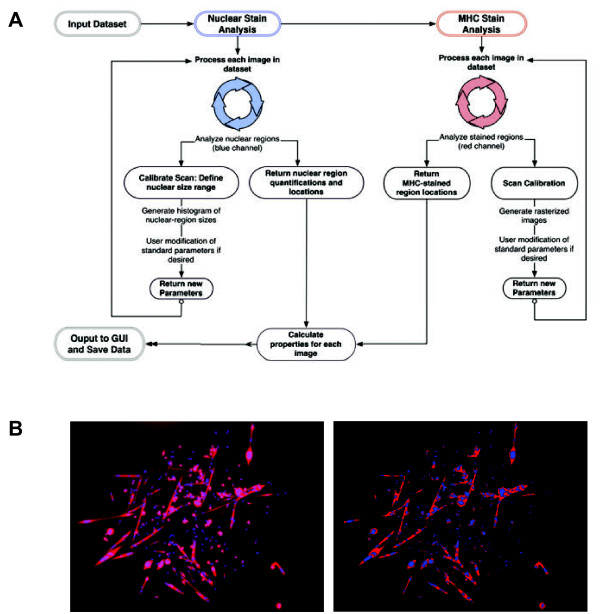
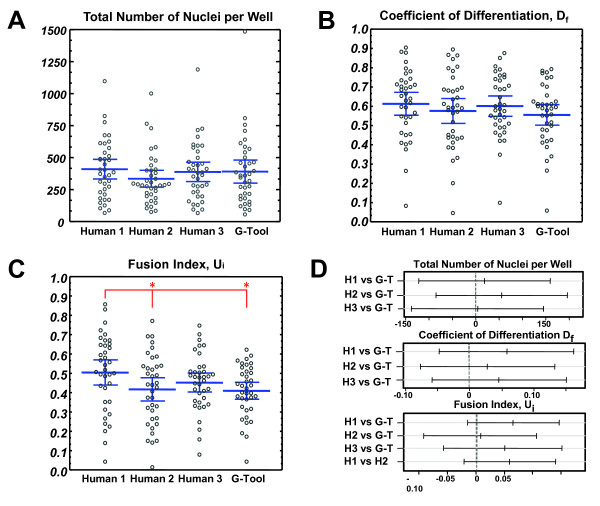
Methods: We present G-Tool, a multiplatform (Java) open-source algorithm that analyzes an ensemble of fluorescent micrographs of satellite cell-derived colonies to provide quantitative and statistically meaningful metrics of myogenic potential, including proliferation capacity and propensity to differentiate.

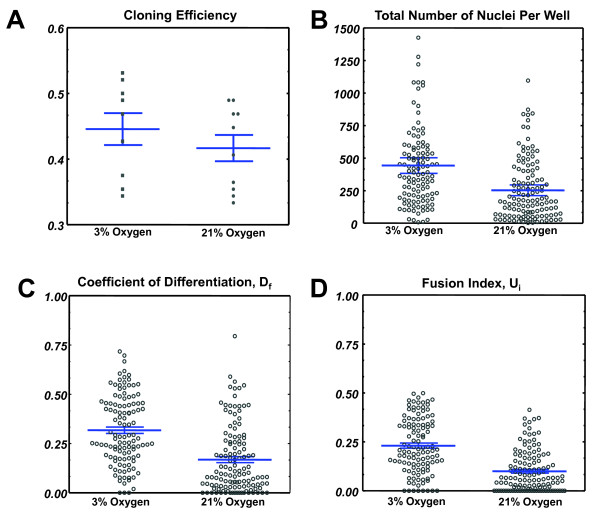
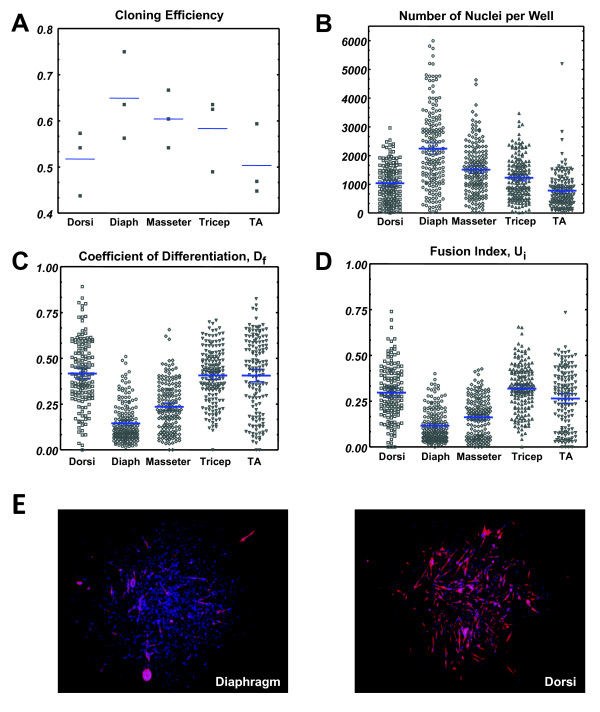
Results: We demonstrate the utility of G-Tool in two applications: first, we quantify the response of satellite cells to oxygen concentration. Compared to 3% oxygen which approximates tissue levels, we find that 21% oxygen, the ambient level, markedly limits the proliferative potential of transit amplifying progeny but at the same time inhibits the rate of terminal myogenic differentiation. We also test whether satellite cells from different muscles have intrinsic differences that can be read out in vitro. Compared to masseter, dorsi, forelimb and hindlimb muscles, we find that the diaphragm satellite cells have significantly increased proliferative potential and a reduced propensity to spontaneously differentiate. These features may be related to the unique always-active status of the diaphragm.

Conclusions: G-Tool facilitates consistent and reproducible CFC analysis between experiments and individuals. It is released under an open-source license that enables further development by interested members of the community.


Figures

Figure 1
Figure 1
Flow chart of program algorithm. (A) G-Tool algorithm flowchart. (B) Left: An example satellite cell colony. Right: G-Tool rasterized version of the colony. Red denotes myosin heavy chain (MHC) + cytoplasm. Nuclei are blue. Flow chart of program algorithm. (A) G-Tool algorithm flowchart. (B) Left: An example satellite cell colony. Right: G-Tool rasterized version of the colony. Red denotes myosin heavy chain (MHC) + cytoplasm. Nuclei are blue.
Figure 2
Figure 2
4',6-Diamidino-2-phenylindole (DAPI) region sizes interpreted by G-Tool. (A) Histogram showing DAPI + region sizes identified by G-Tool in a dataset containing >23,000 nuclei (C57BL/6 hindlimb satellite cells). The histogram is color coded to reflect the different sizes of nuclei that are visible in the library of images. (B) Left: An example satellite cell colony. Right: G-Tool rasterized version (magnified) of this relatively simple colony. Red denotes myosin heavy chain (MHC) + cytoplasmic regions. The DAPI + regions are colored according to the scheme defined by the histogram in (A). (C) Left: An example of a very dense satellite cell colony. Right: G-Tool rasterized version (magnified). Human counting of the regions of densely packed nuclei would be highly variable.
Figure 3
Figure 3
Manual vs G-Tool counting. (A) Number of nuclei per colony, counted manually by three different individuals, and compared to G-Tool. Blue bars represent mean and 95% confidence intervals. (B) Coefficient of differentiation, Df, counted as in (A). Blue bars represent mean and 95% confidence intervals. (C) Fusion index, Ui, counted as in (A). Blue bars represent mean and 95% confidence intervals. Pairwise paired t test results: human 1 vs human 2 (P value = 4E-4)*, human 1 vs human 3 (P value = 0.22), human 1 vs G-Tool (P value = 6E-4)*, human 2 vs human 3 (P value = 0.40), human 2 vs G-Tool (P value = 0.77), human 3 vs G-Tool (P value = 0.22). *Paired t test shows a statistically significant difference between means at 95% confidence interval. (D) Statistical analysis: the differences between G-Tool and humans 1 to 3 is not statistically significant for eight of nine parameters. Tukey pairwise comparison test is shown comparing G-Tool counting to human counting for the total number of nuclei per well, the coefficient of differentiation, and the fusion index. If the pairwise range contains zero, the difference between the pair is not statistically significant. Blue bars represent mean and 95% confidence intervals. By Shapiro-Wilke test, data for Df and Ui were found to be normally distributed while number of nuclei showed a slight deviation from normality. We performed analysis of variance (ANOVA) and Tukey honestly significant difference (HSD) test on square root-transformed number of nuclei data and found that the same results were obtained with this normalized data set.
Figure 4
Figure 4
Colony-forming cells (CFCs) assayed at 3% vs 21% O2. (A) Cloning efficiency (frequency of single satellite cells that generated a colony in a single well) under low (3%) oxygen and ambient (20%) oxygen. Blue bars represent mean and 95% confidence intervals. (B) Number of nuclei per colony for the low and ambient oxygen groups. Blue bars represent mean and 95% confidence intervals. (C) The coefficient of differentiation, Df, for the two experimental groups. Blue bars represent mean and 95% confidence intervals. (D) The fusion index, Ui, for the two experimental groups. Blue bars represent mean and 95% confidence interval. Blue bars represent mean and 95% confidence intervals.
Figure 5
Figure 5
Colony-forming cell (CFC) analysis of different muscle groups. (A) Cloning efficiency for all five muscle groups across three replicates (independent mice). Cloning efficiency represents the percentage of wells in a 96-well plate that show satellite cell colony formation. Each data point represents one plate. Blue bars represent the mean. (B) The total number of nuclei per colony for each of five muscle groups. Blue bars represent mean and 95% confidence intervals. (C) The coefficient of differentiation, Df for all five muscle groups. Blue bars represent mean and 95% confidence intervals. (D) The fusion index, Ui for all five muscle groups. Blue bars represent mean and 95% confidence intervals. (E) Example colonies. Left: typical diaphragm colony. Right: typical dorsi colony showing high differentiation percentage. Blue bars represent mean and 95% confidence intervals. Diaph = diaphragm; TA = tibialis anteriors.

References

    1. Mauro A. Satellite cell of skeletal muscle fibers. J Biophys Biochem Cytol. 1961;9:493–495. doi: 10.1083/jcb.9.2.493. - DOI - PMC - PubMed
    1. Collins CA, Olsen I, Zammit PS, Heslop L, Petrie A, Partridge TA, Morgan JE. Stem cell function, self-renewal, and behavioral heterogeneity of cells from the adult muscle satellite cell niche. Cell. 2005;122:289–301. doi: 10.1016/j.cell.2005.05.010. - DOI - PubMed
    1. Sacco A, Doyonnas R, Kraft P, Vitorovic S, Blau HM. Self-renewal and expansion of single transplanted muscle stem cells. Nature. 2008;56:502–506. - PMC - PubMed
    1. Montarras D, Morgan J, Collins C, Relaix F, Zaffran S, Cumano A, Partridge T, Buckingham M. Direct isolation of satellite cells for skeletal muscle regeneration. Science. 2005;309:2064–2067. doi: 10.1126/science.1114758. - DOI - PubMed
    1. Mendell JR, Kissel JT, Amato AA, King W, Signore L, Prior TW, Sahenk Z, Benson S, McAndrew PE, Rice R, Nagaraja H, Stephens R, Lantry L, Morris GE, Burghes AHM. Myoblast transfer in the treatment of Duchenne’s muscular dystrophy. N Engl J Med. 1995;333:832–838. doi: 10.1056/NEJM199509283331303. - DOI - PubMed

LinkOut - more resources