. 2012 Jun 15:11:28.
doi: 10.1186/1475-925X-11-28.

Algorithmic processing of pressure waveforms to facilitate estimation of cardiac elastance

Affiliations

Algorithmic processing of pressure waveforms to facilitate estimation of cardiac elastance

David Stevenson et al. Biomed Eng Online. .

Abstract

Background: Cardiac elastances are highly invasive to measure directly, but are clinically useful due to the amount of information embedded in them. Information about the cardiac elastance, which can be used to estimate it, can be found in the downstream pressure waveforms of the aortic pressure (P(ao)) and the pulmonary artery (P(pa)). However these pressure waveforms are typically noisy and biased, and require processing in order to locate the specific information required for cardiac elastance estimations. This paper presents the method to algorithmically process the pressure waveforms.

Methods: A shear transform is developed in order to help locate information in the pressure waveforms. This transform turns difficult to locate corners into easy to locate maximum or minimum points as well as providing error correction.

Results: The method located all points on 87 out of 88 waveforms for Ppa, to within the sampling frequency. For Pao, out of 616 total points, 605 were found within 1%, 5 within 5%, 4 within 10% and 2 within 20%.

Conclusions: The presented method provides a robust, accurate and dysfunction-independent way to locate points on the aortic and pulmonary artery pressure waveforms, allowing the non-invasive estimation of the left and right cardiac elastance.


Figures

Figure 1
Figure 1
Overview. The figure shows a conceptualised overview of the process described in this paper and further implications. From the many measured left cardiac elastance (e(t)) waveforms, alone with many aortic pressure (Pao) waveforms, correlations are derived (the information flow is shown through the large grey arrow). Once these correlations are known, they can be used along with the aortic pressure waveform (from a patient), to arrive at an estimation of their cardiac elastance waveform. The equivalent for the right cardiac elastance is also shown, with the pulmonary artery pressure (Ppa).
Figure 2
Figure 2
Illustrative elastance estimation. An example of what can be done with the identified points on the aortic pressure, and an example of the formation of the estimated cardiac elastance is shown here, while the terms are defined in (5). This figure is not part of the method of this paper, rather as a illustration of what the method as a whole leads to.
Figure 3
Figure 3
Aortic pressure waveform and relevant points. A representative aortic pressure waveform over one heart beat with relevant points (defined in (5)) marked on it. The two dashed circles, MN and RS are used only in locating other points.
Figure 4
Figure 4
Pulmonary artery pressure waveform and relevant points. A representative pulmonary artery pressure waveform over one heart beat with relevant points (defined in (5)) marked on it. The dashed circle, MX is only used to help find other points.
Figure 5
Figure 5
Shear transform. An illustration of the shear transformation of (6), turning a hard to locate “shoulder” ( B¯) points into an easily found maximum point ( B¯).
Figure 6
Figure 6
Use of the shear transform, A. The desired point for MN is P. However, in this example the global minimum of the waveform is P1, which is the initial guess for MN. A shear transform of the pressure waveform between P1 and MX reveals a minimum (P2) outside the range of D, and hence the time of P2 is taken as the time of MN.
Figure 7
Figure 7
Use of the shear transform, B. This example is the other situation in the process of finding MN to Figure 6, i.e. the initial guess of the global minimum for MN is correct. Here, the minimum of the shear transform from P1 to MX falls within the range of D and hence the P1 is taken as MN.
Figure 8
Figure 8
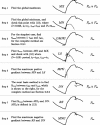
The method. The step by step method for finding the points on Pao and Ppa, as labelled on the right. The graphics beside each step are for illustration only and are not meant to be part of the definition of the method, rather to see the method in operation on a representative Pao waveform. Note that the methods described here for DMPG and DN are note complete as these require a more complex method, refer to Sections Finding DMPG and Finding DN for the complete method for these two points.
Figure 9
Figure 9
Finding DMPG, A. A straight forward case for finding DMPG, where P1 of (17) exists, hence DMPG P1.
Figure 10
Figure 10
Finding DMPG, B. A less common case for finding DMPG, where P1 of (17) does not exist, but P3 does, hence DMPG P3.
Figure 11
Figure 11
Finding DMPG, C. A less common case for finding DMPG, where P1, and P3 of (17) do not exist, but P4 does, hence DMPG P4.
Figure 12
Figure 12
Finding DN. An example of where the first local minimum of the shear transform is the correct time for the point DN.
Figure 13
Figure 13
Where the method fails.Ppa alongside the matching TVE. The automatic or algorithmic method failed to capture the correct DN point (circle), the real DN and associated MX are marked by squares.

Similar articles

Cited by

References

    1. Guyton A, Hall J. Textbook of Medical Physiology. Philadelphia: W.B. Saunders Company; 2000.
    1. Grenvik A, Ayres SM, Holbrook PR. Textbook of Critical Care. Philadelphia: W.B. Saunders Company; 1989.
    1. Angus DC, Linde-Zwirble WT, Lidicker J, Clermont G, Carcillo J, Pinsky MR. Epidemiology of severe sepsis in the United States: analysis of incidence, outcome, and associated costs of care. Crit Care Med. 2001;29(7):1303–10. doi: 10.1097/00003246-200107000-00002. - DOI - PubMed
    1. Kearon C. Diagnosis of pulmonary embolism. CMAJ. 2003;168(2):183–94. - PMC - PubMed
    1. Pineda LA, Hathwar VS, Grant BJB. Clinical Suspicion of Fatal Pulmonary Embolism. Chest. 2001;120(3):791–5. doi: 10.1378/chest.120.3.791. [ http://chestjournal.chestpubs.org/content/120/3/791.full] - DOI - PubMed

Publication types