

Spinal muscular atrophy associated with progressive myoclonic epilepsy is caused by mutations in ASAH1
- PMID: 22703880
- PMCID: PMC3397266
- DOI: 10.1016/j.ajhg.2012.05.001
Spinal muscular atrophy associated with progressive myoclonic epilepsy is caused by mutations in ASAH1
Abstract
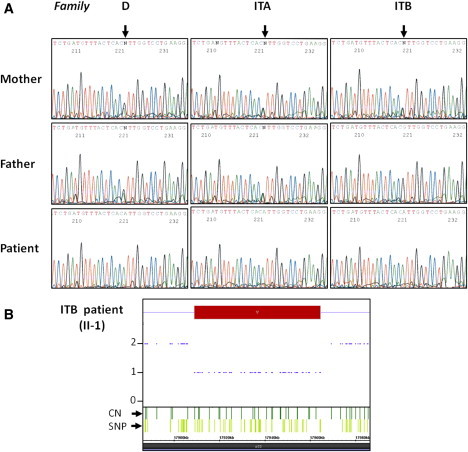
Spinal muscular atrophy (SMA) is a clinically and genetically heterogeneous disease characterized by the degeneration of lower motor neurons. The most frequent form is linked to mutations in SMN1. Childhood SMA associated with progressive myoclonic epilepsy (SMA-PME) has been reported as a rare autosomal-recessive condition unlinked to mutations in SMN1. Through linkage analysis, homozygosity mapping, and exome sequencing in three unrelated SMA-PME-affected families, we identified a homozygous missense mutation (c.125C>T [p.Thr42Met]) in exon 2 of ASAH1 in the affected children of two families and the same mutation associated with a deletion of the whole gene in the third family. Expression studies of the c.125C>T mutant cDNA in Farber fibroblasts showed that acid-ceramidase activity was only 32% of that generated by normal cDNA. This reduced activity was able to normalize the ceramide level in Farber cells, raising the question of the pathogenic mechanism underlying the CNS involvement in deficient cells. Morpholino knockdown of the ASAH1 ortholog in zebrafish led to a marked loss of motor-neuron axonal branching, a loss that is associated with increased apoptosis in the spinal cord. Our results reveal a wide phenotypic spectrum associated with ASAH1 mutations. An acid-ceramidase activity below 10% results in Farber disease, an early-onset disease starting with subcutaneous lipogranulomata, joint pain, and hoarseness of the voice, whereas a higher residual activity might be responsible for SMA-PME, a later-onset phenotype restricted to the CNS and starting with lower-motor-neuron disease.
Copyright © 2012 The American Society of Human Genetics. Published by Elsevier Inc. All rights reserved.
Figures


References
-
- Lefebvre S., Bürglen L., Reboullet S., Clermont O., Burlet P., Viollet L., Benichou B., Cruaud C., Millasseau P., Zeviani M. Identification and characterization of a spinal muscular atrophy-determining gene. Cell. 1995;80:155–165. - PubMed
-
- Jankovic J., Rivera V.M. Hereditary myoclonus and progressive distal muscular atrophy. Ann. Neurol. 1979;6:227–231. - PubMed
-
- Haliloglu G., Chattopadhyay A., Skorodis L., Manzur A., Mercuri E., Talim B., Akçören Z., Renda Y., Muntoni F., Topaloğlu H. Spinal muscular atrophy with progressive myoclonic epilepsy: Report of new cases and review of the literature. Neuropediatrics. 2002;33:314–319. - PubMed
-
- Rüschendorf F., Nürnberg P. ALOHOMORA: A tool for linkage analysis using 10K SNP array data. Bioinformatics. 2005;21:2123–2125. - PubMed
-
- Abecasis G.R., Cherny S.S., Cookson W.O., Cardon L.R. Merlin—rapid analysis of dense genetic maps using sparse gene flow trees. Nat. Genet. 2002;30:97–101. - PubMed
Publication types
MeSH terms
Substances
Grants and funding
- RC2 HL102926/HL/NHLBI NIH HHS/United States
- HL-102924/HL/NHLBI NIH HHS/United States
- RC2 HL102924/HL/NHLBI NIH HHS/United States
- HL-102926/HL/NHLBI NIH HHS/United States
- HL-102925/HL/NHLBI NIH HHS/United States
- RC2 HL103010/HL/NHLBI NIH HHS/United States
- HL-102923/HL/NHLBI NIH HHS/United States
- RC2 HL102923/HL/NHLBI NIH HHS/United States
- UC2 HL102926/HL/NHLBI NIH HHS/United States
- UC2 HL103010/HL/NHLBI NIH HHS/United States
- HL-103010/HL/NHLBI NIH HHS/United States
- UC2 HL102923/HL/NHLBI NIH HHS/United States
- UC2 HL102924/HL/NHLBI NIH HHS/United States
- RC2 HL102925/HL/NHLBI NIH HHS/United States
- UC2 HL102925/HL/NHLBI NIH HHS/United States
LinkOut - more resources
Full Text Sources
Other Literature Sources
Medical
Molecular Biology Databases
Research Materials
