. 2012 Jun 15;13(6):R45.
doi: 10.1186/gb-2012-13-6-r45.

The genomic landscape shaped by selection on transposable elements across 18 mouse strains

Affiliations

The genomic landscape shaped by selection on transposable elements across 18 mouse strains

Christoffer Nellåker et al. Genome Biol. .

Abstract

Background: Transposable element (TE)-derived sequence dominates the landscape of mammalian genomes and can modulate gene function by dysregulating transcription and translation. Our current knowledge of TEs in laboratory mouse strains is limited primarily to those present in the C57BL/6J reference genome, with most mouse TEs being drawn from three distinct classes, namely short interspersed nuclear elements (SINEs), long interspersed nuclear elements (LINEs) and the endogenous retrovirus (ERV) superfamily. Despite their high prevalence, the different genomic and gene properties controlling whether TEs are preferentially purged from, or are retained by, genetic drift or positive selection in mammalian genomes remain poorly defined.

Results: Using whole genome sequencing data from 13 classical laboratory and 4 wild-derived mouse inbred strains, we developed a comprehensive catalogue of 103,798 polymorphic TE variants. We employ this extensive data set to characterize TE variants across the Mus lineage, and to infer neutral and selective processes that have acted over 2 million years. Our results indicate that the majority of TE variants are introduced though the male germline and that only a minority of TE variants exert detectable changes in gene expression. However, among genes with differential expression across the strains there are twice as many TE variants identified as being putative causal variants as expected.

Conclusions: Most TE variants that cause gene expression changes appear to be purged rapidly by purifying selection. Our findings demonstrate that past TE insertions have often been highly deleterious, and help to prioritize TE variants according to their likely contribution to gene expression or phenotype variation.


Figures
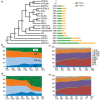
Figure 1
Figure 1
Distribution of TEVs across a phylogeny representing a primary subspecies history of 18 mouse strains. (a) This phylogeny (left), which averages across these strains' known phylogenetic discordances, was imputed by considering TEVs to be discrete morphologies. All nodes were supported by bootstrap values of 100%. Numbers of B6+ and B6- TEV insertions are shown (right), within and without the C57BL/6J lineage, respectively. Unless we have evidence for the contrary, we assume that a strain's genome is identical to that of C57BL/6J. Green and yellow bars represent numbers of TEV insertions in the C57BL/6J lineage (B6+; green) and insertions outside of this lineage (B6-; yellow), respectively. The large number of TEVs in SPRET/EiJ (bottom) indicates that these are most often absent in C57BL/6J (and other lab-based strains), rather than indicating that there is a larger number of TEs in SPRET/EiJ. (b, d) Proportions of TEV classes (ERVs, LINEs and SINEs) across the inferred phylogeny for C57BL/6J (b) and C3H/HeJ (d) lineages. LINE elements are further divided into full-length insertions (> 5 kb) and smaller fragments of LINEs (LINE_frag). (c, e) Proportions of ERV families across the inferred phylogeny for C57BL/6J or C57BL/6NJ (c) and C3H/HeJ or CBA/J (e) lineages. For example, 'AB' indicates insertion events inferred to have occurred after the divergence of SPRET/EiJ from all other strains. Numbers of predicted insertions are given below.
Figure 2
Figure 2
Structure and activities of ERV families. (a) Numbers of bases within nine ERV families present in the C57BL/6J reference genome. (b) Proportions of C57BL/6J bases belonging to each ERV TEV family relative to apparently fixed ERV sequence. These proportions reflect the variable ages and historical activities of ERV families. (c) Percentages of TEV ERVs predicted as having a proviral structure within the C57BL/6J or C57BL/6NJ lineages projected onto the phylogenetic tree from Figure 1. An older ERV insertion shows a greater tendency to be a solo-LTR than a canonical proviral form. (d) Proportions of proviral and solo-LTR structures for each TEV ERV family. Solo-LTR fractions are approximately proportional to the age of the TEVs with the exception of ETn and IAP, which have a higher percentage of solo-LTRs for their age relative to the other families.
Figure 3
Figure 3
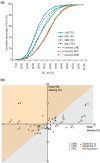
Genome-wide nucleotide composition and chromosome biases for TEV density. (a) Cumulative distributions of TEV families according to their genomic GC context. SINE TEVs tend to occur in GC-rich sequence while LINE and ERV TEVs each show an AT preference, with the notable exception of the MuLV family, which is biased towards GC. TEVs showed no differences in these biases compared to all TEs in the reference genome assembly. (b) Chromosome biases in the densities of TEVs (x-axis) and apparently fixed TEs (y-axis). Each axis represents the observed density divided by the density expected from genome-wide random samples of sequence approximately matched according to G+C content (Materials and methods). Significant density deviations from the null expectation are indicated by color for TEVs or fixed TEs (yellow) or both (red). The spread in observed densities across chromosomes is greater for TEVs compared with the older, apparently fixed, TEs. There is a general tendency for chromosomes that exhibit elevated (decreased) TE densities to also exhibit increased (lower) densities of TEVs (excluding chromosome X: SINE R2 = 0.6756, P < 10-4; LINE R2 = 0.0054, P < 0.7; ERV R2 = 0.3836, P < 0.0047). The quadrants shaded grey match this correlation in ratios between TEVs and fixed TEs. Nevertheless, this trend does not explain the higher than expected density of TEVs on the X chromosome when compared with its lower than expected TE density. All chromosomal TE density points that fall within the orange shaded area show signals of positive selection according to the McDonald-Kreitman test (FDR 0.1%).
Figure 4
Figure 4
Genome-wide nucleotide composition, gene structure and gene annotation biases for TEV occurrence. (a) Having accounted for these GC biases, TEVs are substantially and significantly depleted (red shades) in exons and introns, with the notable exception of SINEs that are enriched (green shades) in intronic regions. Both SINE and ERV TEVs are enriched in 5 kb upstream and downstream flanking regions of genes, while LINEs are depleted. (b, c) Gene annotations that are significantly enriched (green shades) or depleted (red shades) in intronic or intergenic TEV insertions having accounted for GC content, and intronic or intergenic lengths, and after adjusting for multiple tests. Gene annotations are from either the Gene Ontology (slim set) (b) or the Mouse Genome Informatics phenotypes associated with gene disruptions (c), and are shown when at least one significant association (P < 10-6) was observed. SINE TEVs show a pattern of enrichments and depletions that is the complement of the patterns for LINE and ERV TEVs. * Sequence-Specific DNA binding Transcription Factor activity.
Figure 5
Figure 5
Densities and orientations of TEVs with respect to the transcriptional (sense) direction of mouse genes. (a) Orientation bias within first, middle and last introns of protein coding genes. All TEV types occur preferentially in the antisense orientation, with the ERV TEV bias being the strongest. ERV TEVs show a lower bias in the first introns of genes (P < 10-3 by chi-square test). SINE TEVs show a significantly stronger orientation bias in the first introns of protein coding genes (P < 10-3). (b) Orientation biases are not significantly different between 'young' and 'old' TEVs, categorized using percentage sequence divergence from the repeat consensus sequence (x-axis). *** indicates P < 10-3.
Figure 6
Figure 6
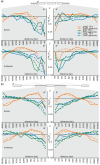
Densities of intergenic TEVs in the proximity of gene boundaries. (a) Densities of TEVs (full lines) or of TEs from the reference C57BL/6J assembly (dashed lines) 5' of genes' transcriptional start sites (left panels) or 3' of genes' transcriptional stop sites (right panels). The top two panels represent TEVs and TEs that occur in the transcriptional sense orientation, whereas the bottom two panels represent those present in the antisense orientation. For each family, the densities of TEVs (y-axis) present within distance bins (x-axis) from the gene are shown relative to the TEV density observed. Bin sizes were selected from the Fibonacci series, which allowed improved visualization of TEV densities compared to linear or logarithmic scales. All TEVs and TEs are depleted in close proximity to the 5' of genes, but SINEs are enriched upstream (approximately 500 bp to 10 kbp) of genes. No significant effects of TEV orientation on density distributions in the vicinity of genes were observed. (b) Densities of intronic TEVs in the proximity of exon boundaries. Densities of intronic TEVs (full lines) or of TEs from the reference C57BL/6J assembly (dashed lines) 5' of exons (left panels) or 3' of exons (right panels). The top two panels represent TEVs and TEs that occur in the transcriptional sense orientation, whereas the bottom two panels represent those present in the antisense orientation. For each family, the densities of TEVs (y-axis) present within distance bins (x-axis) from the gene are shown relative to the TEV density observed. Bin sizes were selected from the Fibonacci series, which allowed improved visualization of TEV densities compared to linear or logarithmic scales. A difference in density profiles of sense and antisense TEVs is observed in proximity to exon boundaries.
Figure 7
Figure 7
Enrichment of TEVs within merge QTL regions and functional impact of CTCF-binding TEVs. (a) The density of TEVs within genomic intervals associated with refined ('Merge') QTLs or adjacent sequence lying within nonrefined QTLs relative to all genomic regions was tested using a genome-wide association test. SINE TEVs show a 13.9% enrichment in regions associated with refined merge QTLs over the level expected given interval size and GC composition. Both LINE and SINE TEVs show greater densities within merge QTL regions compared to surrounding non-merge QTL sequence. With the exception of ERV TEVs in merge QTL regions, all associations were statistically significant (***P < 10-3). (b) Variation in expression between genes associated with a CTCF-binding TEV. The natural log of the ratio of expression between the upstream and downstream genes (whose order was randomly assigned) was taken as a measure of the variance in expression. The presence of the CTCF binding TEV was associated with a greater degree of expression variation between flanking genes (ANOVA P < 0.001). N/s, not significant.
Figure 8
Figure 8
An example of a genomic region with a CTCF-binding TEV, in this case an IAP-I provirus. The presence of the IAP-I is associated with differential expression of Slc36a1 (P < 0.05, genome wide FDR 0.05) across the strains but not of Fat2. The IAP-I is present in the strains 129P2/OlaHsd, 129S1/SvImJ, 129S5/SvEvBrd, A/J, AKR/J, BALB/cJ, C3H/HeJ, C57BL/6NJ, CBA/J, DBA/2J, LP/J, NOD/ShiLtJ, CAST/EiJ, PWK/PhJ and WSB/EiJ.

Comment in

Similar articles

Cited by

References

    1. Gogvadze E, Buzdin A. Retroelements and their impact on genome evolution and functioning. Cell Mol Life Sci. 2009;66:3727–3742. doi: 10.1007/s00018-009-0107-2. - DOI - PMC - PubMed
    1. Shapiro JA. Mobile DNA and evolution in the 21st century. Mob DNA. 2010;1:4. doi: 10.1186/1759-8753-1-4. - DOI - PMC - PubMed
    1. Belancio VP, Hedges DJ, Deininger P. Mammalian non-LTR retrotransposons: for better or worse, in sickness and in health. Genome Res. 2008;18:343–358. doi: 10.1101/gr.5558208. - DOI - PubMed
    1. Cordaux R, Batzer MA. The impact of retrotransposons on human genome evolution. Nat Rev Genet. 2009;10:691–703. doi: 10.1038/nrg2640. - DOI - PMC - PubMed
    1. Stocking C, Kozak CA. Murine endogenous retroviruses. Cell Mol Life Sci. 2008;65:3383–3398. doi: 10.1007/s00018-008-8497-0. - DOI - PMC - PubMed

Publication types

MeSH terms

Substances

LinkOut - more resources