. 2012 Jun 14;11(6):617-30.
doi: 10.1016/j.chom.2012.04.017.

Plasmacytoid dendritic cells are productively infected and activated through TLR-7 early after arenavirus infection

Affiliations

Plasmacytoid dendritic cells are productively infected and activated through TLR-7 early after arenavirus infection

Mónica Macal et al. Cell Host Microbe. .

Abstract

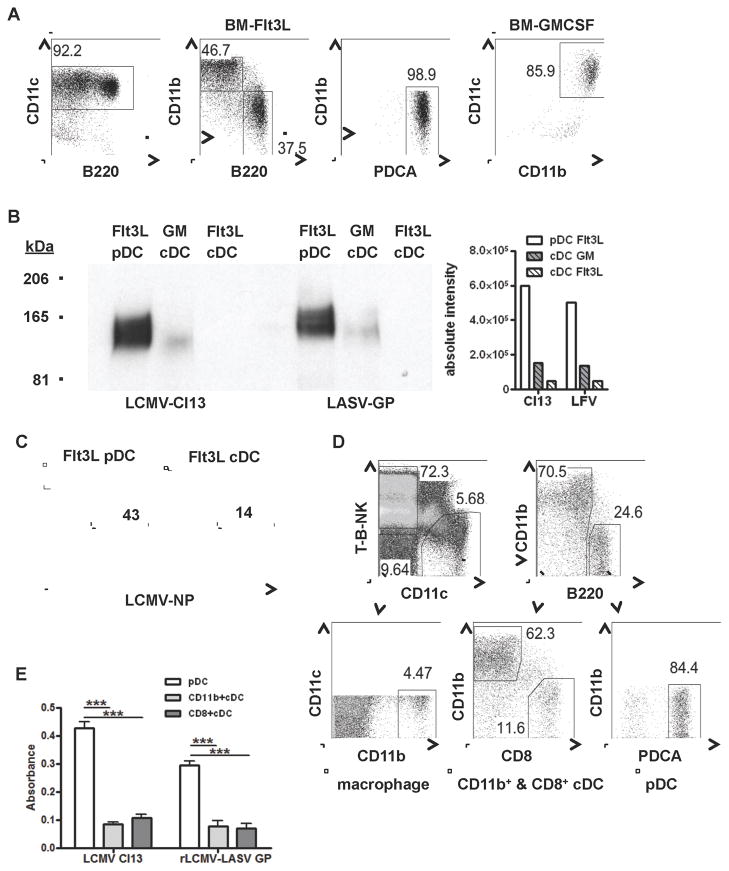
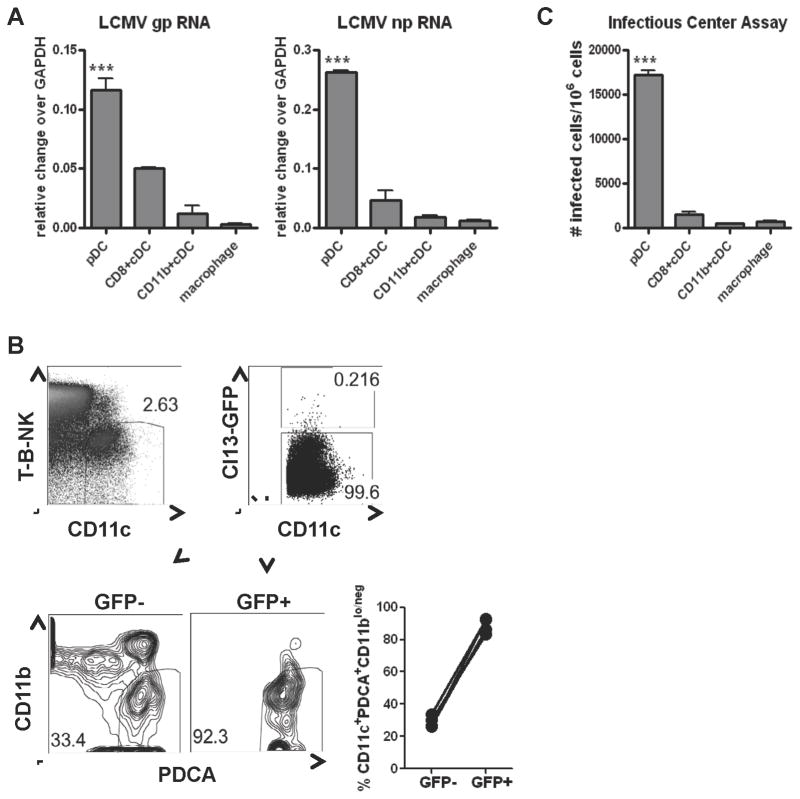
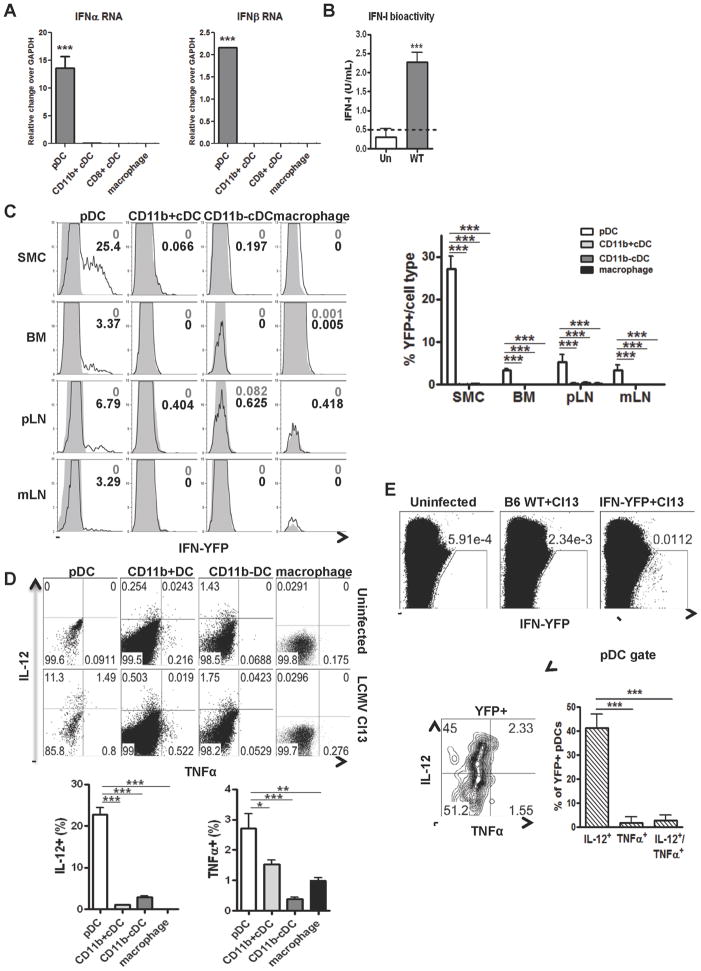
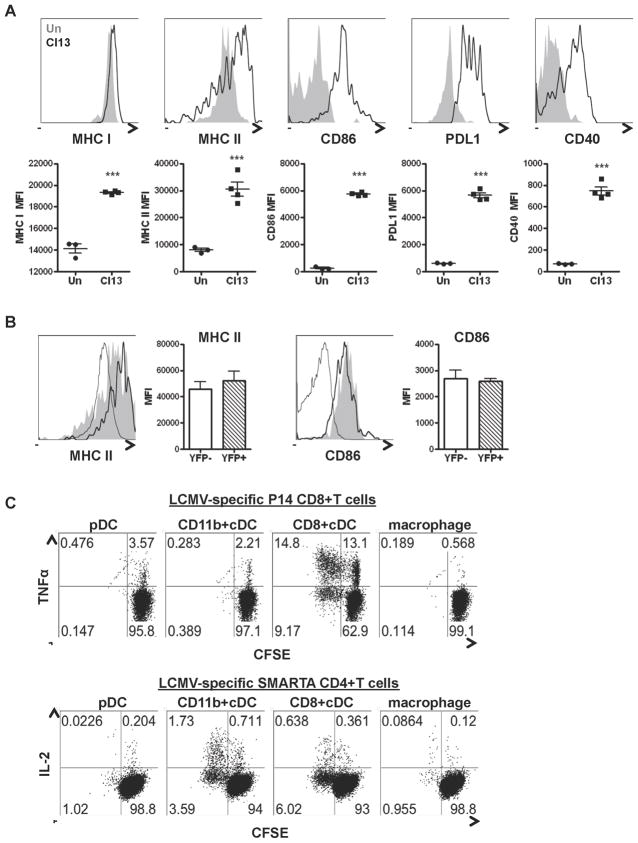
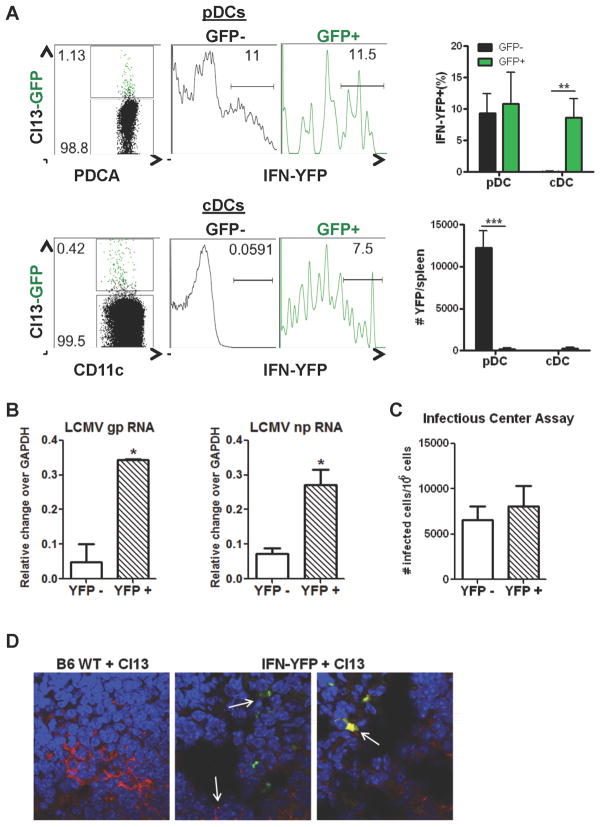
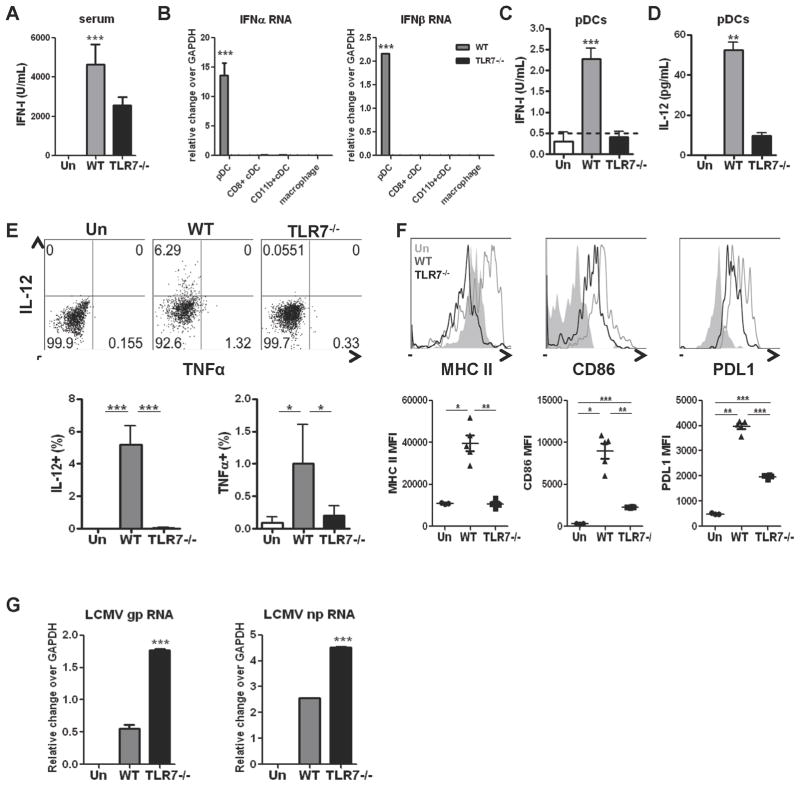
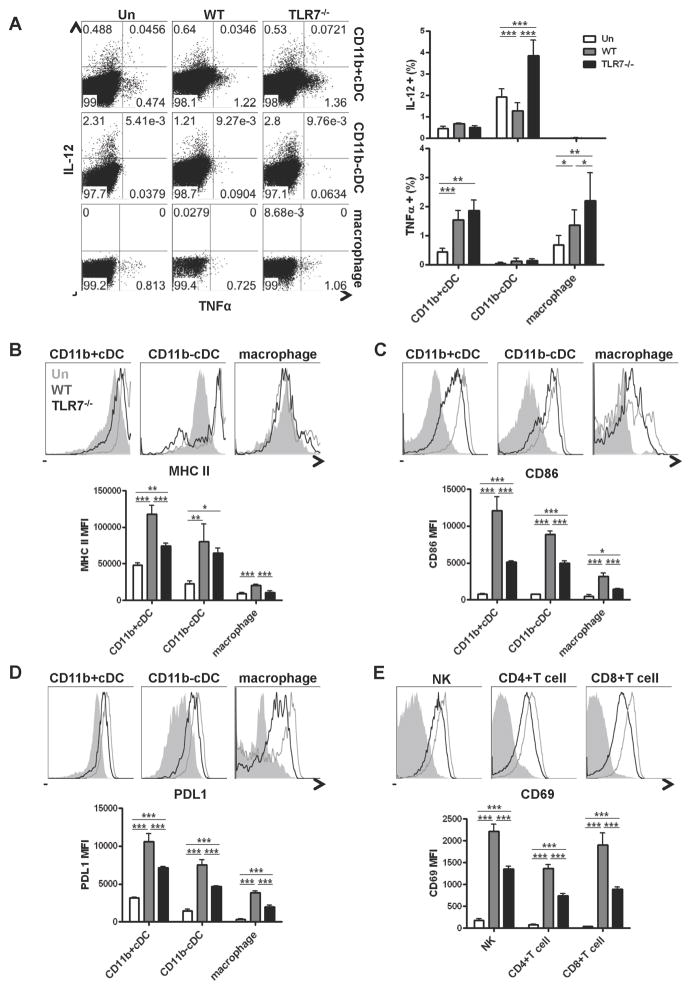
The antiviral response is largely mediated by dendritic cells (DCs), including conventional (c) DCs that function as antigen-presenting cells, and plasmacytoid (p) DCs that produce type I interferons, making them an attractive target for viruses. We find that the Old World arenaviruses lymphocytic choriomeningitis virus clone 13 (LCMV Cl13) and Lassa virus bind pDCs to a greater extent than cDCs. Consistently, LCMV Cl13 targets pDCs early after in vivo infection of its natural murine host and establishes a productive and robust replication cycle. pDCs coproduce type I interferons and proinflammatory cytokines, with the former being induced in both infected and uninfected pDCs, demonstrating a dissociation from intrinsic virus replication. TLR7 globally mediates pDC responses, limits pDC viral load, and promotes rapid innate and adaptive immune cell activation. These early events likely help dictate the outcome of infections with arenaviruses and other DC-replicating viruses and shed light on potential therapeutic targets.


Figures

Figure 1
Figure 1. pDCs express high levels of Old-world arenavirus binding proteins
A–C. BM cells from uninfected (A–B) or day 3 LCMV Cl13 infected mice (C) were cultured with GM-CSF to generate cDCs or Flt3L to generate pDCs and cDCs. A. At day 8–10 post-culture pDCs were identified as CD11c+CD11bB220+PDCA+ and cDCs were identified as CD11c+CD11b+B220 (Flt3L) and CD11c+CD11b+ (GM-CSF). B. pDCs and cDCs were processed for virus overlay assay with LCMV Cl13 or LASV-GP. Virus binding to pDC or cDC protein homogenates is shown at 165kDa, similar to the molecular weight for α-DG. C. At day 4 post-culture Flt3L BM cultures were stained with anti-LCMV-NP Ab and analyzed by flow cytometry. Data are representative of 2–3 experiments. D–E. Splenic pDCs (T-B-NKCD11c+CD11bB220+PDCA+), CD11b+ cDCs (T-B-NKCD11c+CD11b+B220), and CD8+cDCs (T-B-NK CD11c+CD11bB220 CD8+) (D) were purified from uninfected mice and protein lysates were analyzed for LCMV Cl13 and LASV GP (rLCMV-LASV GP) binding, measured by virus binding assay (E). Spleens were pooled from 5 mice in 2 independent experiments. Bar graphs depict the mean±SD. *p<0.05, **p<0.001, ***p<0.0001.
Figure 2
Figure 2. Rapid and productive pDC infection by LCMV Cl13 in vivo
C57Bl/6 (WT) mice were infected with WT LCMV Cl13 (A&C) or r3LCMVCl13-GFP (Cl13-GFP; B). Spleens were pooled from 3–5 mice per group at day 1 p.i. and processed for FACS purification of pDCs, CD8+ and CD11b+ cDCs, and macrophages as described in figure 1D. A. LCMV gp and np RNA levels were determined relative to gapdh by qPCR. Bar graph depicts the mean±standard deviation (SD) of triplicates. B. The percentage of CD11c+PDCA+CD11blo/neg cells within GFP+ and GFP DCs was evaluated by flow cytometry. Representative plots are shown. Graph depicts the percentage of PDCA+CD11blo/neg cells within DC gate, where circles represent individual mice C. Infectious center assay determined the number of productively infected cells per million cells. Bar graphs depict the mean±SD. All results are representative of 3–4 experiments with 3–5 mice/group. p<0.05, **p<0.001, ***p<0.0001. See also Figure S1.
Figure 3
Figure 3. Early pDC cytokine production during LCMV Cl13 infection
WT (A, B, D) and IFNβmob/mob(C&E) mice were left uninfected or infected with LCMV Cl13 and sacrificed at day 1 p.i. A. Spleens were pooled from 3–5 mice/group and processed for FACS purification. Ifnα and Ifnβ RNA transcript levels were determined relative to gapdh by qPCR. B. Splenic FACS-purified pDCs from uninfected (white bar) and LCMV Cl13 infected (gray bar) mice were cultured 15hrs in media. IFN-I levels in supernatants were measured by bioassay. C. YFP expression was analyzed by flow cytometry in pDCs, CD11b+cDCs (CD11c+B220CD11b+), CD11bcDCs (CD11c+B220CD11b) and macrophages from spleen, BM, pLN and mLN of WT and IFNβmob/mob Cl13 infected mice. Representative histograms from uninfected (gray solid) and infected (black unfilled) mice are shown. Bar graphs depict percentage of YFP+ cells/cell type in lymphoid tissues. D. IL-12p40 and TNFα production in splenic pDCs, CD11b+ and CD11bcDCs, and macrophages was determined by flow cytometry. Representative dot plots for uninfected and infected mice are shown. Bar graphs depict percentage of IL-12p40+ and TNFα+ cells. E. YFP+ splenocytes from IFNβmob/mob infected mice were analyzed for IL-12p40 and TNFα expression by flow cytometry. Representative dot plots are shown. Bar graphs depict percentage of IL-12p40+ and TNFα+ cells within YFP+ cells. All bar graphs depict mean±SD and data are representative of 2–3 experiments with 4–5 mice/group. *p<0.05, **p<0.001, ***p<0.0001. See also Figure S2.
Figure 4
Figure 4. pDCs matured but remained poor antigen presenting cells during LCMV Cl13 infection
WT (AC) and IFNβmob/mob (B) mice were left uninfected or infected with LCMV Cl13 and splenocytes were obtained at day 1 p.i. A. MHC I, MHC II, CD86, PDL1 and CD40 expression in pDCs was determined by flow cytometry. Representative histograms of uninfected (gray solid) and infected (black unfilled) mice are shown. Graphs depict mean±SD of mean fluorescence intensity (MFI) for indicated molecules, where symbols represent individual mice B. MHC II and CD86 expression was analyzed by flow cytometry in YFP and YFP+ pDCs from IFNβmob/mob infected mice. Representative histograms for uninfected pDC (gray unfilled) and infected YFP (gray solid) and YFP+ (black unfilled) pDCs are shown. Bar graphs depict mean±SD of MFI for indicated molecules C. pDCs, CD11b+ and CD8+cDCs, and macrophages were FACS-purified from pooled splenocytes of infected mice and co-cultured with CFSE-labeled naïve P14 CD8+ or SMARTA CD4+ T cells for 72hrs. T cells were analyzed for proliferation (CFSE) and TNFα or IL-2 production by P14 and SMARTA cells, respectively. All results are representative of 2–4 experiments with 4–5 mice/group. *p<0.05, **p<0.001, ***p<0.0001. See also Figure S3.
Figure 5
Figure 5. pDC produce IFN-I independent of intrinsic LCMV Cl13 replication
WT or IFNβmob/mob mice were left uninfected or infected with either Cl13-GFP (A) or WT LCMV Cl13 (B–D) and spleens were processed at day 1 p.i. A. YFP signal was analyzed by flow cytometry in infected (GFP+) and uninfected (GFP) PDCA enriched pDCs and cDCs. Representative dot plots are shown. B–C. Spleens were pooled from 4–5 mice/group for FACS purification of YFP+ and YFP pDCs. LCMV gp and np RNA transcript levels were determined relative to gapdh (B). Productively infected YFP+ vs. YFP pDCs were quantified by infectious center assay (C). Bar graphs represent mean±SD. D. Spleens were evaluated for IFNβ (green) and LCMV Cl13 (red) localization by confocal microscopy. Nuclei are stained with DAPI (blue). White arrows indicate IFNβ producing and Cl13-infected cells (middle panel) and double positive stained cells (right panel). All bar graphs depict mean±SD and results are representative of 2–3 independent experiments with 3–5 mice/group. *p<0.05, **p<0.001, ***p<0.0001. See also Figure S4.
Figure 6
Figure 6. pDCs sense in vivo LCMV Cl13 infection through TLR7
WT or TLR7−/− mice were left uninfected or infected with WT LCMV Cl13 and serum (A) or spleens (B–G) were processed at day 1 p.i. A. Serum IFN-I activity was measured by luciferase bioassay. B–D. pDCs, CD11b+ and CD8+ cDCs, and macrophages were FACS-purified from spleens pooled from 4–5 mice per group. Ifnα and Ifnβ transcript levels were determined relative to gapdh by qPCR (B). pDCs were cultured and supernatants collected at 15 hrs to measure IFN-I bioactivity, where dotted line indicates limit of bioassay detection (C), or IL-12p70 levels (D). E. The percentage of IL-12p40+ and TNFα+ pDCs was determined by flow cytometry. Representative dot plots are shown. F. MHC II, CD86, and PDL1 expression were analyzed in pDCs by flow cytometry. MFI±SD are graphed where symbols represent individual mice. Representative histogram of uninfected (gray solid), and Cl13 infected WT (gray unfilled) and TLR7−/− (black unfilled) mice are shown. G. LCMV gp and np transcripts were quantified in FACS-purified pDCs by qPCR. All bar graphs depict mean±SD and data are representative of 2–3 independent experiments with 3–5 mice/group. *p<0.05, **p<0.001, ***p<0.0001.
Figure 7
Figure 7. TLR7 mediates early activation of innate and adaptive immune cells
WT or TLR7−/− mice were left uninfected or infected with WT LCMV Cl13 and spleens were processed at day 1 p.i. A. The percentage of IL-12+ and TNFα+ CD11b+ and CD11bcDCs, and macrophages was determined by flow cytometry. Representative dot plots are shown. Bar graph depicts mean ± SD. B–D. MHC II, CD86, and PDL1 expression were analyzed in CD11b+cDCs (B), CD11bcDCs (C), and macrophages (D) by flow cytometry. E. NK, CD4+ and CD8+T cells were analyzed by flow cytometry for expression of CD69. Representative histogram of uninfected (gray solid), and Cl13 infected WT (gray unfilled) and TLR7−/− (black unfilled) mice are shown. Graphs depict mean MFI±SD. All results are representative of 3–4 independent experiments with 3–5 mice/group. *p<0.05, **p<0.001, ***p<0.0001

Comment in

Similar articles

Cited by

References

    1. Ahmed R, Salmi A, Butler LD, Chiller JM, Oldstone MB. Selection of genetic variants of lymphocytic choriomeningitis virus in spleens of persistently infected mice. Role in suppression of cytotoxic T lymphocyte response and viral persistence. J Exp Med. 1984;160:521–540. - PMC - PubMed
    1. Baize S, Kaplon J, Faure C, Pannetier D, Georges-Courbot MC, Deubel V. Lassa virus infection of human dendritic cells and macrophages is productive but fails to activate cells. J Immunol. 2004;172:2861–2869. - PubMed
    1. Banchereau J, Steinman RM. Dendritic cells and the control of immunity. Nature. 1998;392:245–252. - PubMed
    1. Barton LL, Mets MB, Beauchamp CL. Lymphocytic choriomeningitis virus: emerging fetal teratogen. Am J Obstet Gynecol. 2002;187:1715–1716. - PubMed
    1. Bergthaler A, Flatz L, Hegazy AN, Johnson S, Horvath E, Lohning M, Pinschewer DD. Viral replicative capacity is the primary determinant of lymphocytic choriomeningitis virus persistence and immunosuppression. Proc Natl Acad Sci U S A. 2010;107:21641–21646. - PMC - PubMed

Publication types

MeSH terms

LinkOut - more resources