. 2012 Jun 14;11(6):631-42.
doi: 10.1016/j.chom.2012.05.003.

Timing and magnitude of type I interferon responses by distinct sensors impact CD8 T cell exhaustion and chronic viral infection

Affiliations

Timing and magnitude of type I interferon responses by distinct sensors impact CD8 T cell exhaustion and chronic viral infection

Yaming Wang et al. Cell Host Microbe. .

Abstract

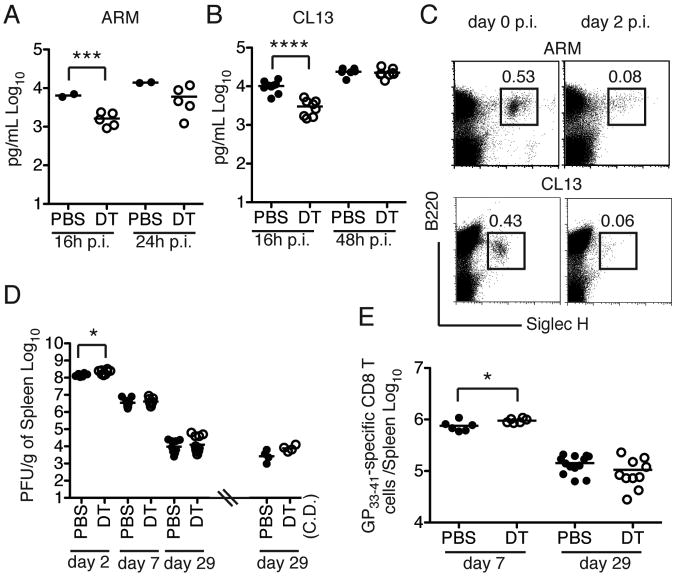
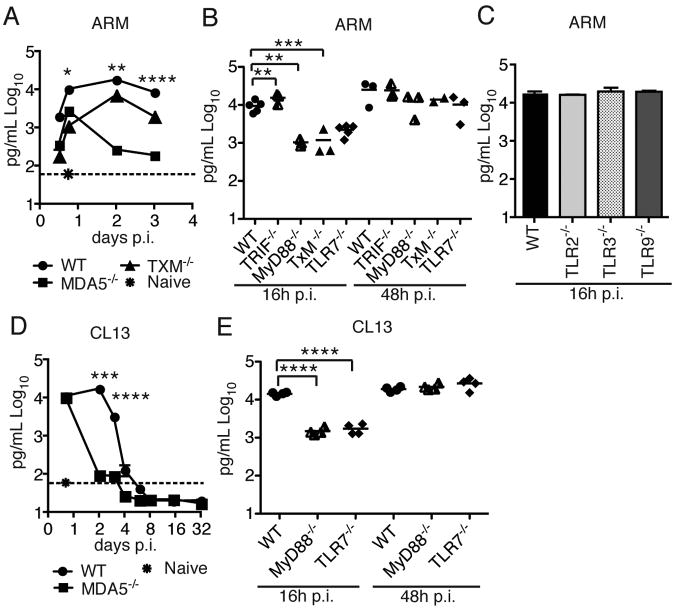
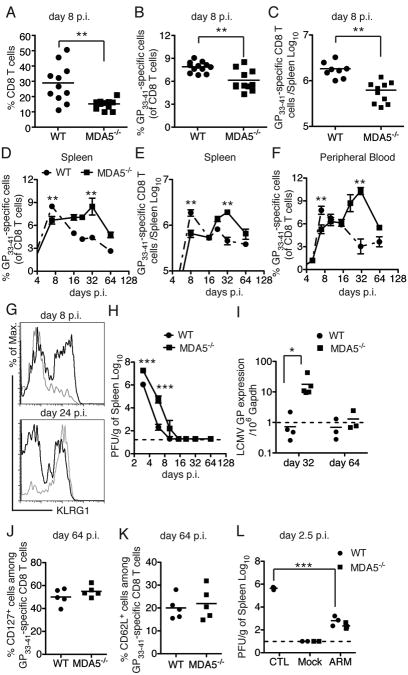
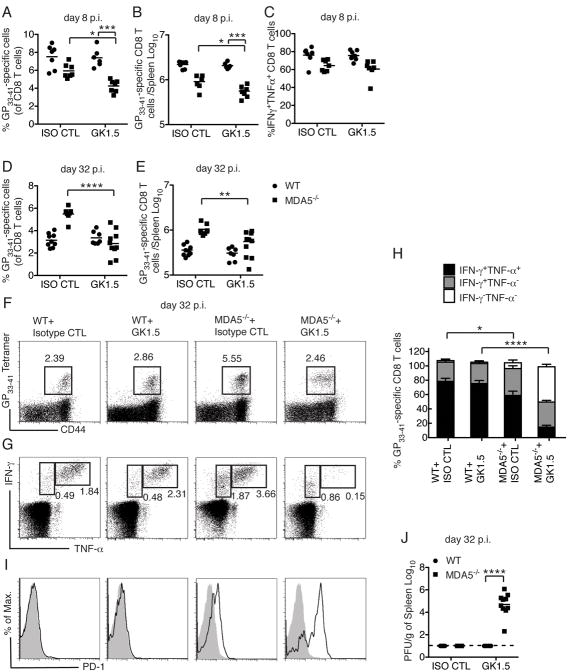
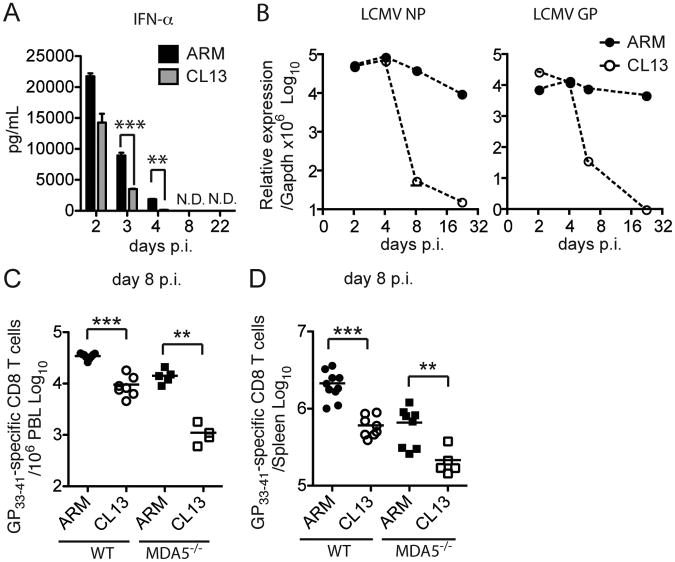
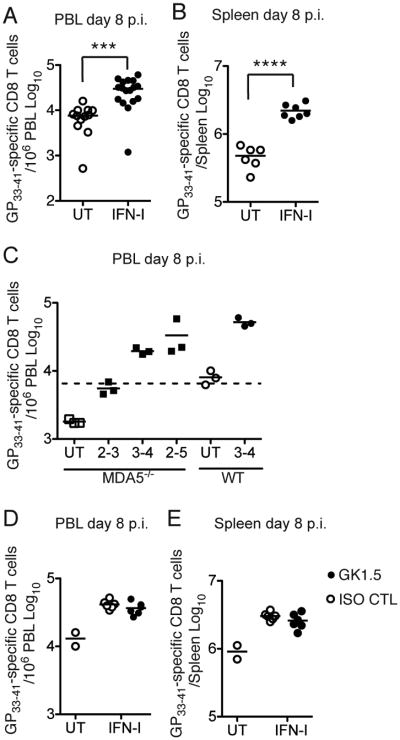
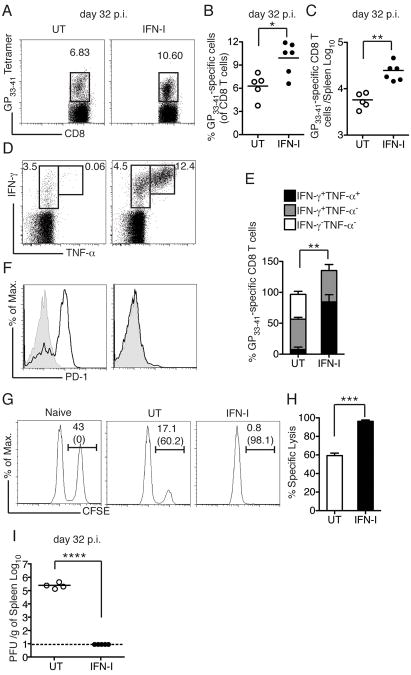
Type I interferon (IFN-I) promotes antiviral CD8(+)T cell responses, but the contribution of different IFN-I sources and signaling pathways are ill defined. While plasmacytoid dendritic cells (pDCs) produce IFN-I upon TLR stimulation, IFN-I is induced in most cells by helicases like MDA5. Using acute and chronic lymphocytic choriomeningitis virus (LCMV) infection models, we determined that pDCs transiently produce IFN-I that minimally impacts CD8(+)T cell responses and viral persistence. Rather, MDA5 is the key sensor that induces IFN-I required for CD8(+)T cell responses. In the absence of MDA5, CD8(+)T cell responses to acute infection rely on CD4(+)T cell help, and loss of both CD4(+)T cells and MDA5 results in CD8(+)T cell exhaustion and persistent infection. Chronic LCMV infection rapidly attenuates IFN-I responses, but early administration of exogenous IFN-I rescues CD8(+)T cells, promoting viral clearance. Thus, effective antiviral CD8(+)T cell responses depend on the timing and magnitude of IFN-I production.


Conflict of interest statement

The authors have no further conflicts of interest.

Figures

Figure 1
Figure 1. (see also S1). Contribution of pDCs to IFN-I and CD8 T cell responses to LCMV
BDCA2-DTR (DTR) mice treated with PBS or DT were infected with ARM (A) or CL13 (B) and serum IFN-α was measured at different time points p.i. (C) Frequencies of pDCs in spleens of WT mice infected with either ARM or CL13 on day 2 p.i. were compared to frequencies of pDCs in naive mice (day 0). (D) DTR mice were injected with PBS or DT during the first week of infection with CL13 to deplete pDCs and viral titers in the spleen were determined. Dots on the right side of the hash mark indicate CL13 titers on day 29 p.i. in spleens of mice treated with PBS or DT for the entire duration of the experiment (chronic depletion, CD.). (E) Total number of GP33–41 specific CD8 T cells in spleens of PBS or DT-treated mice infected with CL13. Data are representative of experiments that were repeated 2-4 times. **** = p<0.0001; *** = p<0.001. * = p<0.05, Student's t-test.
Figure 2
Figure 2. Contribution of TLR7/MyD88 and MDA5 pathways to IFN-I production during LCMV infection
(A-E) Serum IFN-α in response to ARM (A-C) or CL13 (D,E) at various time points p.i. 2-10 mice from multiple experiments were analyzed for each time point. The dotted lines in (A) and (D) indicate IFN-α baseline in serum from uninfected mice. Error bars represent the mean +/- SEM. **** = p<0.0001; *** = p<0.001. ** = p<0.01. * = p<0.05, Student's t-test.
Figure 3
Figure 3. (see also S2). Impact of MDA5 deficiency on the CD8 T cell response and viral clearance during ARM infection
(A) Frequencies of splenic CD8 T cells on day 8 p.i. (B) Frequencies and (C) absolute numbers of splenic LMCV GP33–41 specific CD8 T cells on day 8 p.i. (D) Frequencies and (E) absolute numbers of splenic LMCV GP33–41 specific CD8 T cells at various time points during ARM infection. (F) Frequencies of LMCV GP33–41 specific CD8 T cells in peripheral blood during ARM infection. (G) KLRG1 expression on GP33–41 specific CD8 T cells in spleens of WT (black histogram) and MDA5−/− (gray histogram) mice. (H, I) Viral burden in spleens was examined by plaque assay (H) and qPCR for glycoprotein (GP) RNA (I) at various time points p.i. (J, K) Frequencies of CD127+ cells (J) and CD62L+ cells (K) among LMCV GP33–41 specific CD8 T cells in spleens on day 64 p.i. (L) 2×10⁶ purified CD8 T cells from ARM-infected WT and MDA5−/− mice on day 64 p.i. were transferred into naïve WT mice. Mice were infected (ARM) or not (Mock) with 3×10⁵ ARM 16 h post transfer; control mice (CTL), which did not receive T cells, were also infected. Viral burden in spleens was analyzed on day 2.5 p.i. The dashed lines represent the minimum level of detection. 3-8 mice were used for analyses at each time point. Error bars represent the mean +/- SEM. *** = p<0.001. ** = p<0.01. * = p<0.05, Student's t-test.
Figure 4
Figure 4. (see also Figure S3). Impact of CD4 T cell help on CD8 T cells during ARM infection in the absence of MDA5
Mice were treated with isotype control mAb (ISO CTL) or GK1.5 mAb and infected with ARM. (A-C) Analysis on day 8 p.i. Frequencies (A) and absolute numbers (B) of splenic GP33–41 specific CD8 T cells. (C) Frequencies of IFN-γ-and TNF-α-producing CD8 T cells after ex vivo GP33–41 peptide stimulation. (D-J) Analysis on day 32 p.i. Frequencies (D) and absolute numbers (E) of splenic GP33–41 specific CD8 T cells. (F, G) Flow cytometric determination and (H) Percentages of splenic IFN-γ- and TNF-α-producing CD8 T cells afterex vivo GP33–41 peptide stimulation. (I) PD-1 expression (black histogram) among GP33–41 specific CD8 T cells. Gray histograms show PD-1 expression on naïve CD8 T cells. (J) Viral burden in spleens was also measured. Data are representative of two independent experiments with 3-5 mice/group in each experiment. Error bars represent the mean +/- SEM. **** = p<0.0001; *** = p<0.001; * = p<0.05, Student's t-test.
Figure 5
Figure 5. IFN-I production, viral replication and CD8 T cell responses during ARM and CL13 infections
Serum IFN- α (A) and LCMV NP and GP RNA load (B) in spleens of WT mice infected with 3×10⁶ PFU of ARM or CL13 i.v. were measured. (C, D) GP33–41 specific CD8 T cells in peripheral blood (C) and spleen (D) were analyzed on day 8 p.i. Data are representative of at least two independent experiments with a minimum of 3 mice/group. Error bars represent the mean +/- SEM. *** = p<0.001. ** = p<0.01. * = p<0.05, Student's t-test.
Figure 6
Figure 6. (see also Figure S4). IFN-I treatment boosts the CD8 T cell response during CL13 infection
(A, B) WT mice were treated with IFN-I or not (UT) on days 3 and 5 p.i. with CL13. Numbers of GP33–41 specific CD8 T cells were determined in peripheral blood (PBL) (A) and spleen (B) on day 8 p.i. (C) MDA5−/−and WT mice were UT or treated with IFN-I on the indicated days p.i. GP33–41 specific CD8 T cells were analyzed in PBL on day 8 p.i. (D, E) WT mice were treated with control (ISO CTL) or GK1.5 mAb on days −1 and +1 p.i. IFN-I was administered or not on days 3 and 5 p.i. GP33–41 specific CD8 T cells were analyzed in PBL (D) and spleen (E) on day 8 p.i. Data represent at least two independent experiments with 2-5 mice/group. **** = p<0.0001; *** = p<0.001, Student's t-test.
Figure 7
Figure 7. IFN-I treatment prevents CD8 T cell exhaustion and chronic LCMV infection
(A-E) CL13-infected WT mice were treated with IFN-I or not (UT) on days 3 and 5 p.i. Spleens of UT and IFN-I-treated mice were analyzed on day 32 p.i. for frequencies (A, B) and absolute numbers (C) of GP33–41 specific CD8 T cells. (D, E) IFN-γ and TNF-α production by CD8 T cells afterex vivoGP33–41 peptide stimulation was also analyzed. (F) PD-1 expression (black histogram) among GP33–41 specific CD8 T cells was determined. Gray histograms indicate PD-1 expression of naïve CD8 T cells. (G, H) In vivo cytotoxicity of virus-specific CD8 T cells was performed in naïve or CL13-infected mice with or without IFN-I treatment. (I) Spleen viral load in CL13-infected mice with or without IFN-I treatment. Data represent at least two independent experiments with 2-5 mice/group. Error bars represent the mean +/- SEM. **** = p<0.0001; *** = p<0.001; ** = p<0.01; * = p<0.05, Student's t-test.

Comment in

Similar articles

Cited by

References

    1. Ahmed R, Butler LD, Bhatti L. T4+ T helper cell function in vivo: differential requirement for induction of antiviral cytotoxic T-cell and antibody responses. J Virol. 1988;62:2102–2106. - PMC - PubMed
    1. Andrews DM, Estcourt MJ, Andoniou CE, Wikstrom ME, Khong A, Voigt V, Fleming P, Tabarias H, Hill GR, van der Most RG, et al. Innate immunity defines the capacity of antiviral T cells to limit persistent infection. J Exp Med. 2010;207:1333–1343. - PMC - PubMed
    1. Audige A, Hofer U, Dittmer U, van den Broek M, Speck RF. Evaluation of the immunomodulatory and antiviral effects of the cytokine combination IFN-alpha and IL-7 in the lymphocytic choriomeningitis virus and Friend retrovirus mouse infection models. Viral Immunol. 2011;24:375–385. - PubMed
    1. Barbalat R, Ewald SE, Mouchess ML, Barton GM. Nucleic acid recognition by the innate immune system. Annu Rev Immunol. 2011;29:185–214. - PubMed
    1. Battegay M, Moskophidis D, Rahemtulla A, Hengartner H, Mak TW, Zinkernagel RM. Enhanced establishment of a virus carrier state in adult CD4+ T-cell-deficient mice. J Virol. 1994;68:4700–4704. - PMC - PubMed

Publication types