. 2012 Oct;12(7):1543-50.
doi: 10.1016/j.meegid.2012.06.001. Epub 2012 Jun 13.

The emergence and maintenance of sickle cell hotspots in the Mediterranean

Affiliations

The emergence and maintenance of sickle cell hotspots in the Mediterranean

Bridget S Penman et al. Infect Genet Evol. 2012 Oct.

Abstract

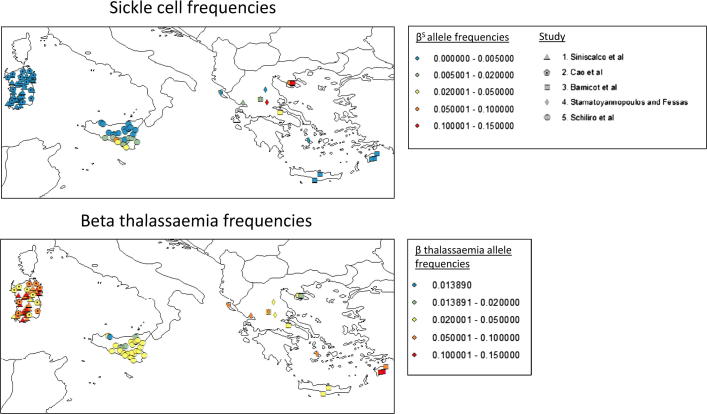
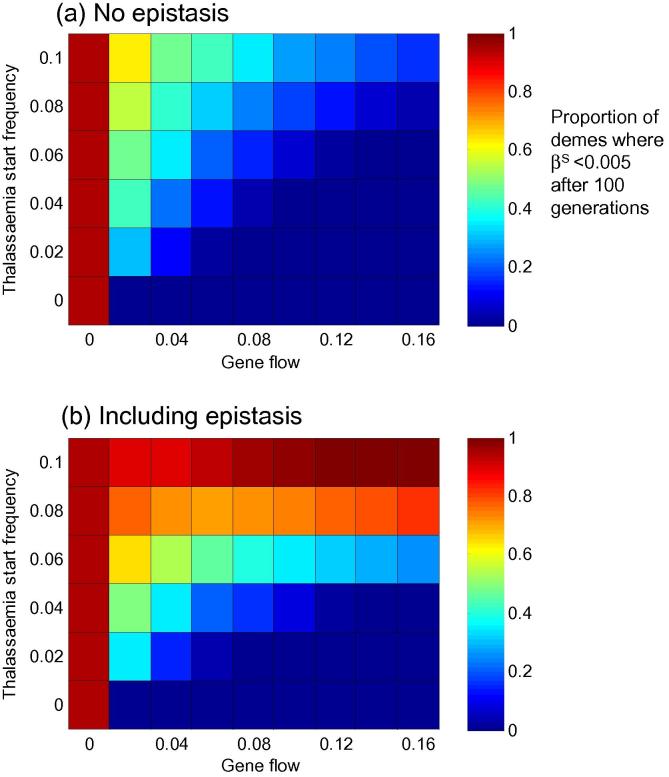
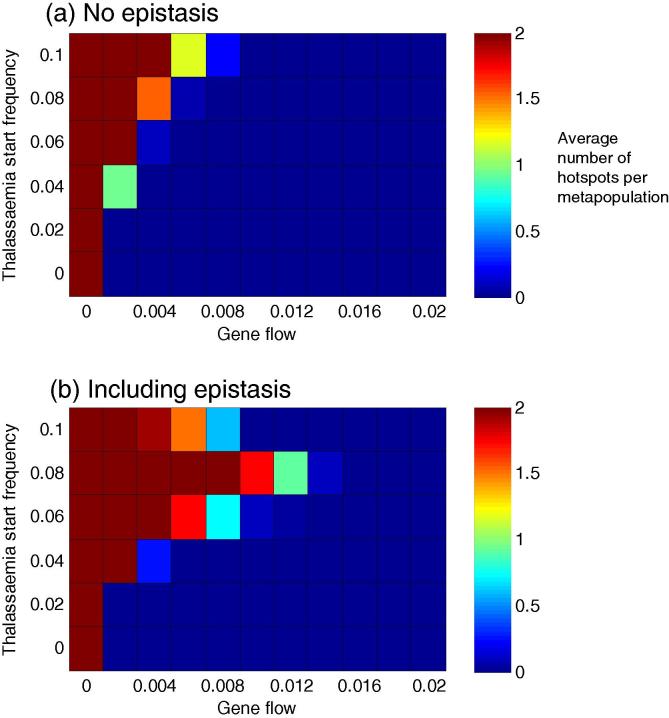
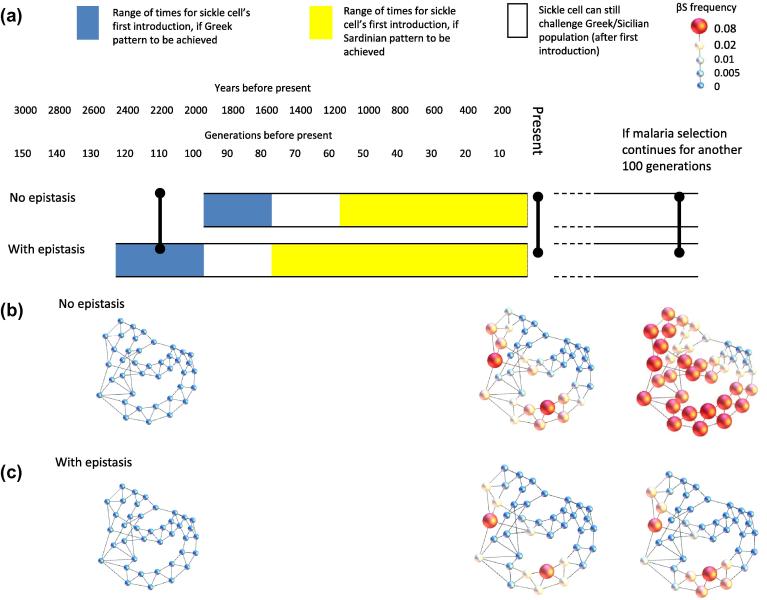
Genetic disorders of haemoglobin (haemoglobinopathies), including the thalassaemias and sickle cell anaemia, abound in historically malarious regions, due to the protection they provide against death from severe malaria. Despite the overall spatial correlation between malaria and these disorders, inter-population differences exist in the precise combinations of haemoglobinopathies observed. Greece and Italy present a particularly interesting case study: their high frequencies of beta thalassaemia speak to a history of intense malaria selection, yet they possess very little of the strongly malaria protective mutation responsible for sickle cell anaemia, despite historical migrational links with Africa where high frequencies of sickle cell occur. Twentieth century surveys of beta thalassaemia and sickle cell in Greece, Sicily and Sardinia have revealed striking sickle cell 'hotspots' - places where the frequency of sickle cell approaches that seen in Africa while neighbouring populations remain relatively sickle cell free. It remains unclear how these hotspots have been maintained over time without sickle cell spreading throughout the region. Here we use a metapopulation model to show that (i) epistasis between the alpha and beta forms of thalassaemia can restrict the spread of sickle cell through a network of linked subpopulations and (ii) the emergence of sickle cell hotspots requires relatively low levels of gene flow, but the aforementioned epistasis increases the chances of hotspots forming.


Figures

Fig. 1
Fig. 1
Visualizing five studies of sickle cell and beta thalassaemia in the Mediterranean. This map summarises data from five studies: (Barnicot et al., 1963; Stamatoyannopoulos and Fessas, 1964; Siniscalco et al., 1966; Cao et al., 2008; Schiliro et al., 1986). Each study recorded the number of beta thalassaemia or sickle cell heterozygotes; we have converted these into allele frequencies, but since homozygotes were excluded from the studies shown these allele frequencies may be a slight underestimate. Supplementary Table S1 provides more information about these data. This map was produced using arcGIS10 (For interpretation to colours in this figure, the reader is refered to the web version of this article.).
Fig. 2
Fig. 2
The effect of gene flow and thalassaemia start frequencies on the spread of sickle cell, with and without epistasis. Panels (a) and (b) illustrate the results of a scenario where βS was first introduced 100 generations ago, into a population containing fixed (and identical) frequencies of both α and β thalassaemia (y axis). Malaria selection is applied to every deme at a level of 0.005 years−1, and after its first introduction, βS is assumed to re-challenge the population in 30% of subsequent generations, chosen at random. The colour of each cell in the heatmap indicates the mean proportion of demes where the frequency of βS is <0.005 after 100 generations. 100 repeated simulations were used to generate each cell. Supplementary Fig. S5 offers a detailed illustration of the data underlying this figure for thalassaemia starting frequencies of 0.04 and 0.08. (For interpretation of the references to colour in this figure legend, the reader is referred to the web version of this article.)
Fig. 3
Fig. 3
The effect of gene flow and thalassaemia start frequencies on the formation of hotspots, with and without epistasis. Panels (a) and (b) illustrate the results of a scenario where βS was first introduced 100 generations ago, into a population containing fixed (and identical) frequencies of both α and β thalassaemia (y axis). Malaria selection is applied to every deme at a level of 0.005 years−1, and after its first introduction, βS is assumed to re-challenge the population in 100% of subsequent generations. The colour of each cell in the heatmap indicates the average number of hotspots observed per metapopulation over 100 simulations at that parameter combination. (For interpretation of the references to colour in this figure legend, the reader is referred to the web version of this article.)
Fig. 4
Fig. 4
A timeline of sickle cell introduction. In this simulation, the mixing level was set at 0.01, and βS was able to challenge the population in 75% of generations after its point of initial introduction. The timeline is based on a generation time of 20 years. The frequencies of both alpha and beta thalassaemia at the beginning of the simulation (200 generations before the present) were 0.02. Thirty repeats were carried out. The Greek and Sardinian patterns were defined as follows: for the Sardinian pattern, the mean proportion of demes with a βS frequency <0.005 must be >0.9; for the Greek pattern, the mean proportion of demes with a βS frequency <0.005 must be >0.5, and the mean number of hotspots for that entry time must be >0.1. The network pictures illustrate snapshots in one possible time line, when sickle cell was first introduced 120 generations ago with (c) or without (b) epistasis. The colour of each node indicates the frequency of βS, and the size of each node indicates the intensity of malaria selection experienced by that deme. The network diagrams in this figure were produced using Gephi (Bastian et al., 2009). (For interpretation of the references to colour in this figure legend, the reader is referred to the web version of this article.)

References

    1. Adams J.W., Kasakoff A.B. Factors Underlying Endogamous Group Size. In: Smith C., editor. Regional Analysis. Academic Press; London: 1976. p. 149.
    1. Allison A.C. Protection afforded by sickle-cell trait against subtertian malareal infection. Br. Med. J. 1954;1:290–294. - PMC - PubMed
    1. Barnicot N.A., Allison A.C., Blumberg B.S., Deliyannis G., Krimbas C., Ballas A. Haemoglobin types in Greek populations. Ann. Hum. Genet. 1963;26:229–236. - PubMed
    1. Bastian, M., Heymann, S., Jacomy, M., 2009. Gephi: An Open Source Software for Exploring and Manipulating Networks.
    1. Boussiou M., Loukopoulos D., Christakis J., Fessas P. The origin of the sickle mutation in Greece; evidence from β(S) globin gene cluster polymorphisms. Hemoglobin. 1991;15:459–467. - PubMed

Publication types

LinkOut - more resources