. 2012 Aug 7;22(15):1371-80.
doi: 10.1016/j.cub.2012.05.047. Epub 2012 Jun 14.

Stochastic, adaptive sampling of information by microvilli in fly photoreceptors

Affiliations

Stochastic, adaptive sampling of information by microvilli in fly photoreceptors

Zhuoyi Song et al. Curr Biol. .

Abstract

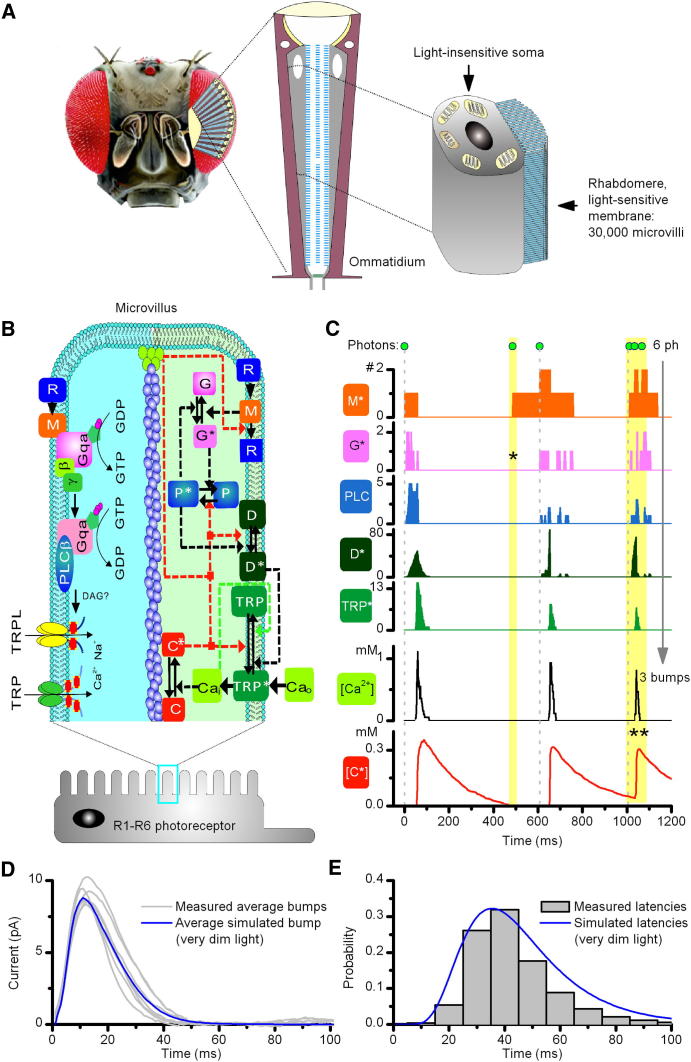
Background: In fly photoreceptors, light is focused onto a photosensitive waveguide, the rhabdomere, consisting of tens of thousands of microvilli. Each microvillus is capable of generating elementary responses, quantum bumps, in response to single photons using a stochastically operating phototransduction cascade. Whereas much is known about the cascade reactions, less is known about how the concerted action of the microvilli population encodes light changes into neural information and how the ultrastructure and biochemical machinery of photoreceptors of flies and other insects evolved in relation to the information sampling and processing they perform.

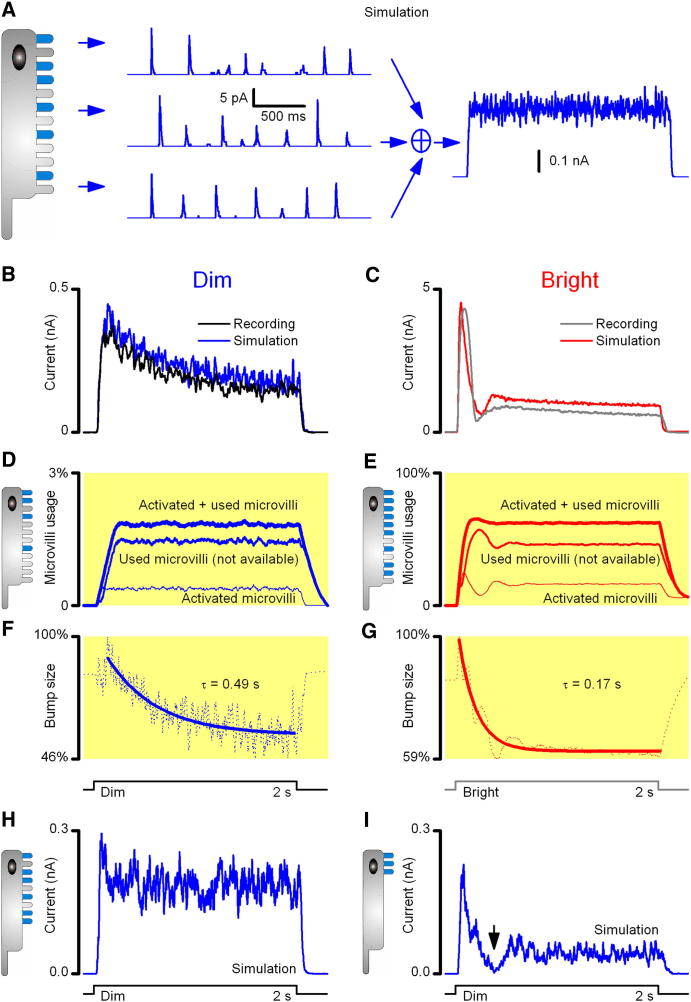
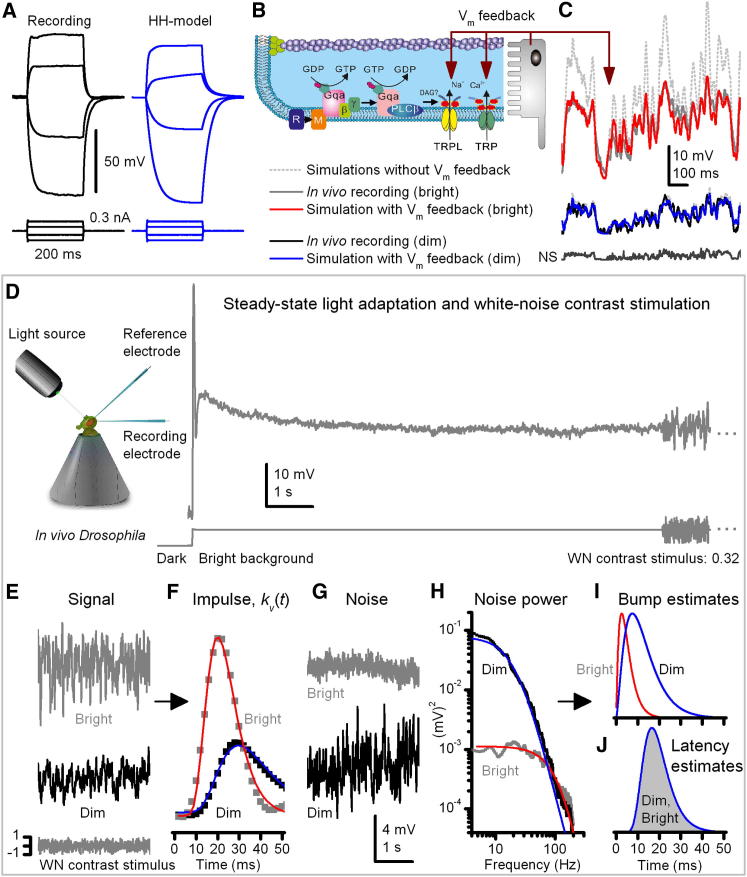
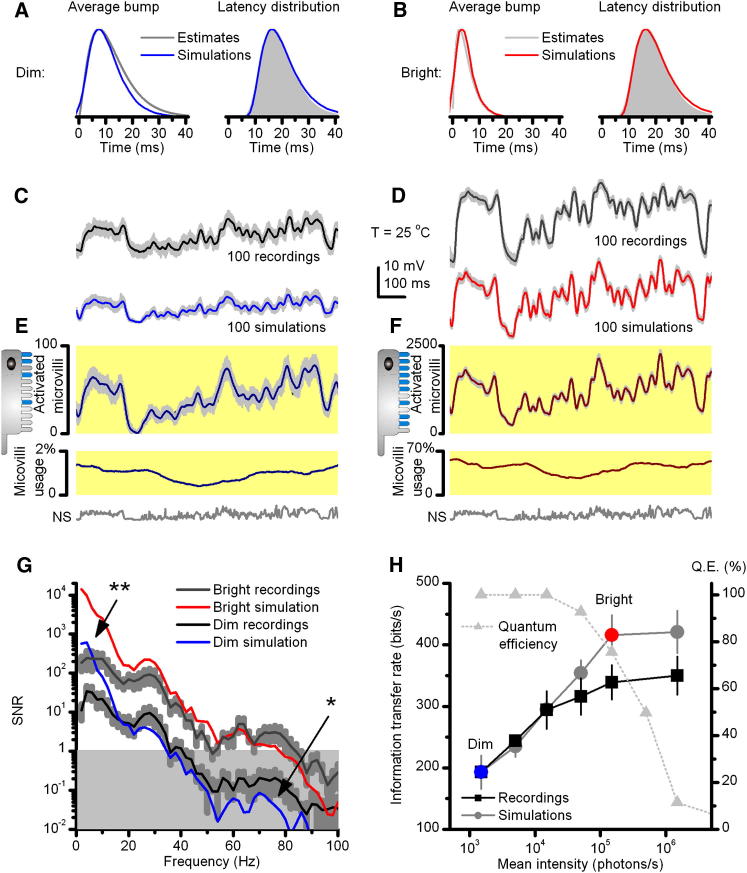
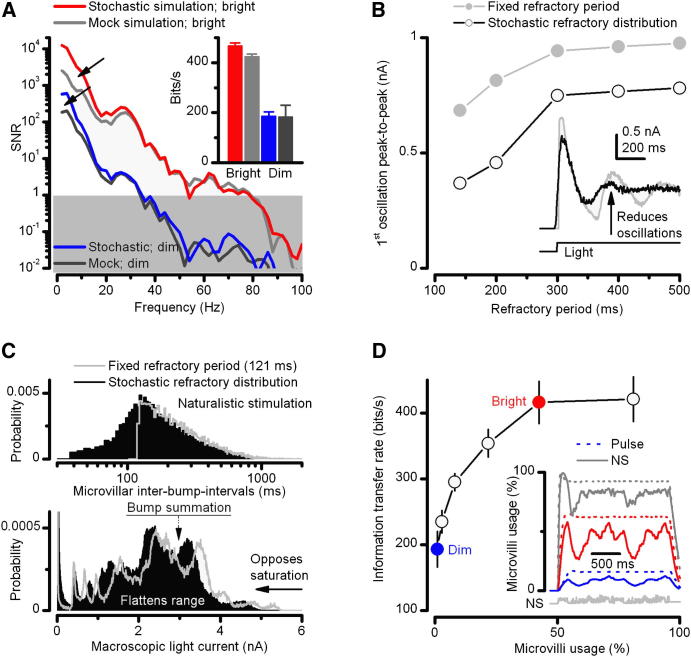
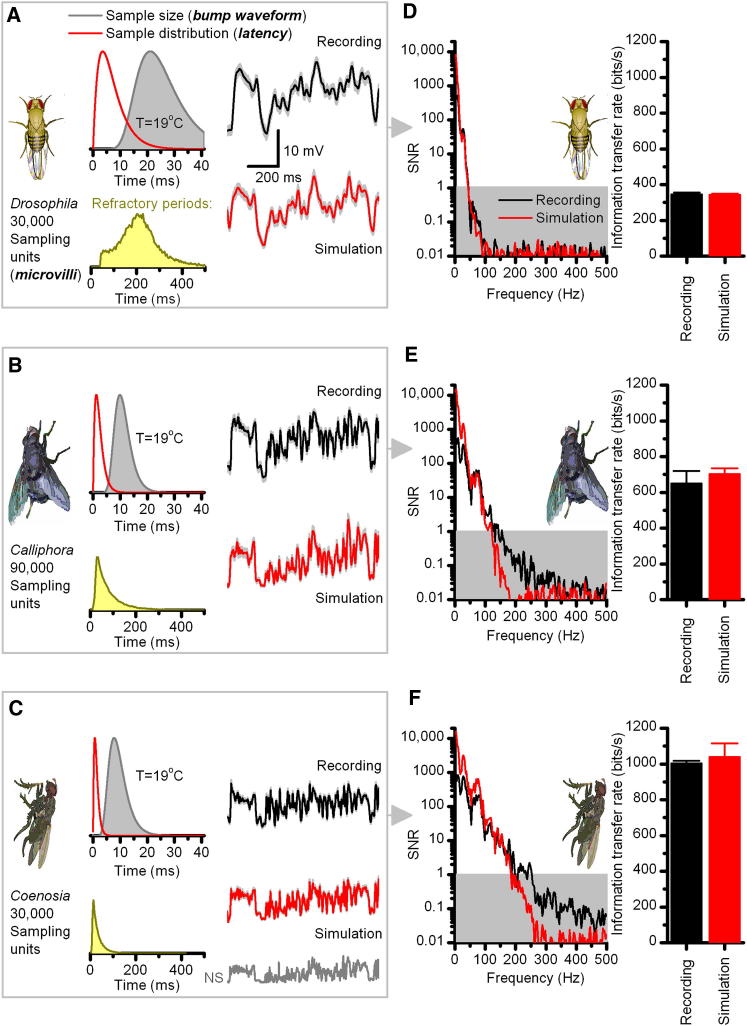
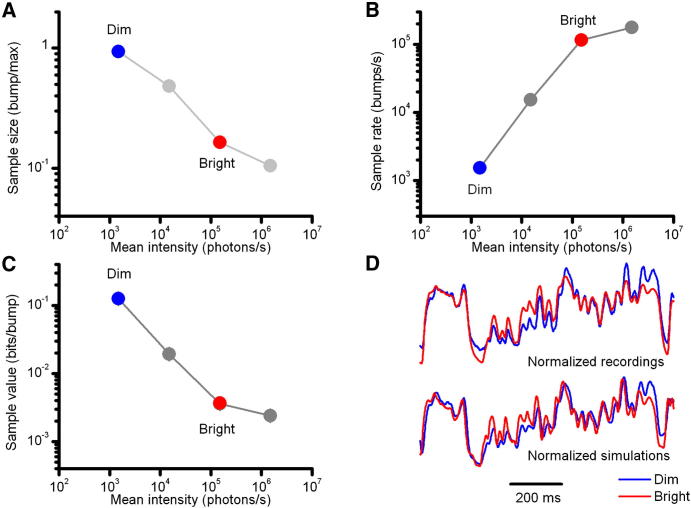
Results: We generated biophysically realistic fly photoreceptor models, which accurately simulate the encoding of visual information. By comparing stochastic simulations with single cell recordings from Drosophila photoreceptors, we show how adaptive sampling by 30,000 microvilli captures the temporal structure of natural contrast changes. Following each bump, individual microvilli are rendered briefly (~100-200 ms) refractory, thereby reducing quantum efficiency with increasing intensity. The refractory period opposes saturation, dynamically and stochastically adjusting availability of microvilli (bump production rate: sample rate), whereas intracellular calcium and voltage adapt bump amplitude and waveform (sample size). These adapting sampling principles result in robust encoding of natural light changes, which both approximates perceptual contrast constancy and enhances novel events under different light conditions, and predict information processing across a range of species with different visual ecologies.

Conclusions: These results clarify why fly photoreceptors are structured the way they are and function as they do, linking sensory information to sensory evolution and revealing benefits of stochasticity for neural information processing.


Figures

Figure 1
Figure 1
Each Microvillus Is a Stochastically Operating Transduction Unit that Produces Bumps (A) Drosophila compound eyes (left) are composed of lens-capped ommatidia (center), each of which contains eight photoreceptors (R1–R8). Right shows schematic of the light-insensitive soma and light-sensitive rhabdomere of an outer photoreceptor (R1–R6). Rhabdomere is made out of 30,000 microvilli. (B) Schematic of phototransduction reactions inside each microvillus. M, metarhodopsin; C, Ca2+-calmodulin complex, which acts as negative feedback to multiple targets; D, DAG; P, G protein-PLC complex. (C) These reactions can be modeled in a stochastic framework, with known molecular interactions, using physiologically measured parameters. Simulated reactions show how a microvillus generates elementary responses (bumps) to captured photons; after a “dead time,” 5-15 TRP-channels open, mediating Ca2+ and Na+ influx into the microvillus. Ca2+-calmodulin complex (red) provides negative feedback, which prevents new bumps until the feedback is low.  = G activation failed; ∗∗ = negative feedback blocked two photon activations. [C]i decay phase is longer than the real refractory period, which represents a balance between the feedbacks; the positive feedback can outgrow the negative one in the middle of [C]i decay. Thus, a bump can be generated without C being zero (e.g., the third bump). (D) Average bumps from seven photoreceptors (whole-cell voltage clamped currents) and an average simulated bump are similar (currents are actually inward: plotted here as outward for consistency). The bump current is computed by equation 11 (Supplemental Experimental Procedures). (E) Latency distributions, including ∼10 ms “dead time,” of simulated and real bumps (data from six wild-type cells) are similar.
Figure 2
Figure 2
Dynamic Availability of Microvilli Shapes Responses to Light (A) Schematic illustration of the main principle of bump summation. Left side shows that trains of bumps in individual microvilli represent discrete, stochastically generated samples of activation. Right side shows that bumps like these sum to generate a continuous noisy LIC response. (B and C) LICs to dim (3,000 photons/s) and bright (3 × 105 photons/s) pulse stimuli, respectively, recorded from dissociated R1–R6 Drosophila photoreceptors during whole-cell patch clamp. Superimposed on these recordings are the simulated LICs to the same dim (blue trace) and bright (red trace) pulse stimuli. LICs are shaped by the number of activated microvilli (shown in D and E) and negative feedback, which reduces the size of the bumps they produce (shown in F and G). (D and E) Output of 30,000 microvilli modeled, showing the fractions of used (refractory) and activated microvilli and their sums in the model simulations to reproduce (B) and (C). Note that microvilli counts are practically immune to changes in negative feedback strength, which reduces their bump size simultaneously (F and G). (F and G) Dotted lines show the difference between normalized LICs (B and C), and the number of activated microvilli (D and E) represents the effect of a reduction in bump waveform on LIC as a function of time (whereas the refractory period affects microvilli usage). During dim stimulation, adaptation (bump size reduction) is slow. In bright stimulation, bump size begins to diminish dramatically already after the first bumps, which shape the initial transient response. Time course of bump adaptation was approximated by single exponentials. (H and I) LICs to a dim pulse stimulus (300 photons/s) of simulated photoreceptors with either 3,000 or 300 identical microvilli. Too few microvilli generate transient responses, because their ongoing photon capture reduces the number of available sampling units for the next round of photons (saturation effect). Therefore, LIC to dim light pulses in photoreceptors with few microvilli (I) looks similar to (but noisier than) the LIC to bright light pulses in photoreceptors with many microvilli (C). In (C) and (I), stochastic (unphased) phototransduction reactions of different microvilli prevent LIC from complete saturation (arrow, no zero DC-signal); even at the start of intense stimulation, there remain microvilli that cannot be light-activated. Refractory microvilli will recover at variable times to the pool of available microvilli (i.e., can then be activated again by light).
Figure 3
Figure 3
Stochastic Microvilli Model with a Hodgkin-Huxley Type Membrane Model Generates Realistic Voltage Responses, Providing a New Framework to Dissect How Photoreceptors Sample Changing Light Information (A) In vivo intracellular (left) and simulated (right) voltage responses to current pulses in darkness. (B) Depolarization causes a global negative voltage feedback, which reduces the driving force for cations entering microvilli through TRP/TRPL channels. (C) Voltage feedback compresses bumps and macroscopic responses, scaling the simulated responses realistically. With voltage feedback, simulated responses to naturalistic light intensity series (dim and bright) mimic the real recordings. Models without voltage feedback used light-adapted bumps but had light-adapted membrane resistance and dark resting potential; their macroscopic responses are shown with gray dotted lines. (D) In vivo experiments; light background adapts a photoreceptor to a steady-state, where its voltage responses to white-noise (WN) contrast stimulus can be analyzed to obtain the average bump waveform and latency distribution [8]. (E) Average responses (signals) to repeated WN contrast at dim (∼1,500 photons/s) and bright (∼1.5 × 105 photons/s) illuminations (backgrounds). (F) Linear impulse responses (squares) approximate how photoreceptors convert dim and bright WN stimuli to voltage responses; impulse responses are fitted with log-normal functions (red and blue traces) [42]. (G) Noise, the difference between signals and responses, is predominantly bump shot noise [8]. (H) Corresponding noise power spectra. (I) Average bump estimates were analytically converted from noise power spectra's gamma-distribution fits (H; smooth traces) [8, 15]. (J) Bump latency distributions for dim and bright illuminations, obtained by deconvoluting average bump estimates from the fitted impulses [8], are virtually identical (shown here by a single blue trace; gray interior indicates distribution). The stochastic photoreceptor model can then be set to operate with these bump statistics (cf. Figure 4).
Figure 4
Figure 4
Encoding Performance of Real and Modeled Drosophila Photoreceptors to Naturalistic Stimuli (NS) Match, Showing that Adaptive Sampling Increases the Flow of Information (A and B) In the simulations, stochastic microvilli models were set to use the corresponding average bump waveforms and latency distributions (here normalized for clarity), estimated from the white-noise contrast experiments at different illuminations (dim and bright; Figures 3H–3I). This was done by refixing two model parameters: ns for the bump shape and la for the latency distribution (see Supplemental Experimental Procedures). (C and D) One hundred superimposed in vivo responses (light gray) and their average signals to repeated naturalistic dim and bright stimuli (equal contrast), respectively, and the corresponding simulations. (E and F) NS activate microvilli stochastically with appropriate dynamics and statistics for the given mean illumination (A and B). Due to low-passing input (1/f-statistics; [1]), the number of activated microvilli is mostly responsible for the corresponding response waveforms (above). This encoding uses only a fraction of 30,000 microvilli (in repeated NS, maximally ∼68%) because NS contain long relatively dim periods, allowing refractory microvilli to return to the pool of available ones during stimulation. (G) The corresponding signal-to-noise ratios (SNR) of real (mean ± SD, n = 5) and simulated responses. ∗∗ marks the difference at lower frequencies, probably due to slow adaptation, instrumental noise and damage, which the model lacks; marks extra information at higher frequencies, probably due to input from other cells in the network, which the model lacks. The overall shape of SNRs reflects 1/f statistics of NS, as dominated by its low-frequency content. (H) Mean rate of information transfer of two best photoreceptors (black) and the model (gray) to the same NS at six different illuminations. Recordings' lower information transfer at three brightest intensities can be attributed to damage, experimental noise, and intracellular pupil, which progressively filter out photons. At dim intensities, the effect of experimental noise and adaptation may be compensated by the synaptic network introducing new information from neighboring photoreceptors [34, 40]. Grey dotted line shows how the quantum efficiency (Q.E.) of simulated photoreceptor output drops with brightening NS, while the information transfer approaches a constant rate. Error bars show SD.
Figure 5
Figure 5
Benefits of Stochasticity and Microvillar Feedbacks on Sampling Light Information (A) Adapted variability of bump waveforms increases low-frequency SNR (arrows) in the macroscopic light current responses to dim and bright naturalistic stimulation. Here, stochastic simulations are compared to mock simulations, in which responses were integrated from decorrelated bumps, taken randomly from the same stochastic bump amplitude and duration distributions. Hence, bump variations even at steady-state adapted conditions are not random but correlate partly with the light history (through the feedback mechanisms within microvilli). These improvements in low-frequency SNR, though, have only a small impact on the rate of information transfer (inset). Responses and their variability are compared in Figures S5H and S5I, respectively. (B) Light currents, integrated from bumps with stochastic refractory distributions, oscillate less than those integrated from bumps with fixed refractory periods. Here, tested for the first oscillation after the initial transient. (C) Stochastic refractory period distribution utilizes the available microvilli more evenly than a fixed refractory period, as seen by its broader inter-bump-interval probability distribution (above). Bumps with stochastic refractory periods integrate macroscopic responses that utilize less (opposing saturation), but more evenly, a photoreceptor's output range (below). In optimal sampling, every microvilli is used equally often. Inter-bump-interval distributions were calculated for 30,000 microvilli individually and the probability over the whole population. Multiple peaks in the probability distribution (below) are characteristic for voltage responses to natural light intensity time series stimuli [1]. (D) A photoreceptor's rate of information transfer reaches maximum when about 50% of its microvilli are in continuous use and is maintained, despite steep fall-off in quantum efficiency (QE) at the brightest intensities (Figure 4H). Inset shows that during very bright naturalistic stimulation, because of its 1/f statistics that contain interspersed darker periods (negative contrasts), proportionally more microvilli recover than during light pulses (thin dotted lines) of equal mean intensity. A very bright pulse (106 photon/s) activates ∼99% of microvilli at the beginning of stimulation, and their usage remains high throughout the pulse. Error bars show SD. (A and D) Bright and dim indicate 3,000 and 3 × 105 photons/s.
Figure 6
Figure 6
Photoreceptor Models of Adaptive Sampling Behave Like Real Photoreceptors (A–C) Photoreceptor output of Drosophila, Calliphora, and Coenosia, respectively, were simulated by stochastic models. We fixed the number of microvilli and approximated their average bump waveforms (dark red) and latency distributions (gray) from in vivo recordings by adjusting the negative feedback strength within their microvilli (by refixing two global negative feedback parameters: ns and la; details in Supplemental Information). These photoreceptor models' voltage responses (red) to the repeated presentations of a naturalistic stimulus (NS) pattern behave as their real counterparts (black). Lower insets show the corresponding refractory periods (inter-bump-intervals, yellow), generated by the microvilli of the models to NS. In (A), because of the lower temperature (19°C), this distribution is wider than the one in Figure 5C (25°C). (D–F) Respective signal-to-noise ratios (SNR) and the corresponding information transfer rates of the simulated responses follow those of the real recordings.
Figure 7
Figure 7
Adaptive Sampling Promotes Contrast Constancy With brightening naturalistic stimulation: (A) The sample size (bump amplitude) is attenuated. (B) More microvilli are activated, increasing sample rate, until progressive reduction in quantum efficiency stabilizes a photoreceptor's bump output. (C) These dynamics (A and B) reduce the amount of information each sample (bump) carries (D) but ensure that relative changes in voltage responses represent naturalistic light changes (contrasts) accurately, irrespective of the ambient illumination. Normalized voltage signals (n = 100 repetitions) to the same naturalistic contrast stimulus shown for both real and simulated Drosophila photoreceptors at dim (1,500 photons/s) and bright (1.5 × 105 photons/s) illuminations. Although contrast gain in absolute terms (voltage/unit contrast) increases with light intensity [8, 12, 26, 34, 43], the temporal structure of the transmitted signal remains practically invariable.

Comment in

Similar articles

Cited by

References

    1. van Hateren J.H. Processing of natural time series of intensities by the visual system of the blowfly. Vision Res. 1997;37:3407–3416. - PubMed
    1. Hardie R.C., Postma M. Phototransduction in microvillar photoreceptors of Drosophila and other invertebrates. In: Basbaum A.I., Kaneko A., Shepherd G.M., Westheimer G., editors. Volume 1. Academic Press; San Diego: 2008. pp. 77–130. (The Senses: A Comprehensive Reference. Vision).
    1. French A.S., Korenberg M.J., Järvilehto M., Kouvalainen E., Juusola M., Weckström M. The dynamic nonlinear behavior of fly photoreceptors evoked by a wide range of light intensities. Biophys. J. 1993;65:832–839. - PMC - PubMed
    1. van Hateren J.H., Snippe H.P. Information theoretical evaluation of parametric models of gain control in blowfly photoreceptor cells. Vision Res. 2001;41:1851–1865. - PubMed
    1. Nikolic K., Loizu J., Degenaar P., Toumazou C. A stochastic model of the single photon response in Drosophila photoreceptors. Integr Biol (Camb) 2010;2:354–370. - PubMed

Publication types

MeSH terms

LinkOut - more resources