

Transient inhibition of cell proliferation does not compromise self-renewal of mouse embryonic stem cells
- PMID: 22705123
- PMCID: PMC3408772
- DOI: 10.1016/j.yexcr.2012.05.017
Transient inhibition of cell proliferation does not compromise self-renewal of mouse embryonic stem cells
Abstract
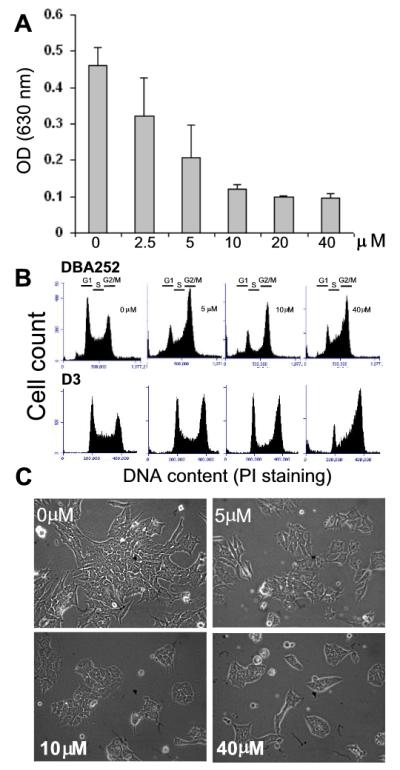
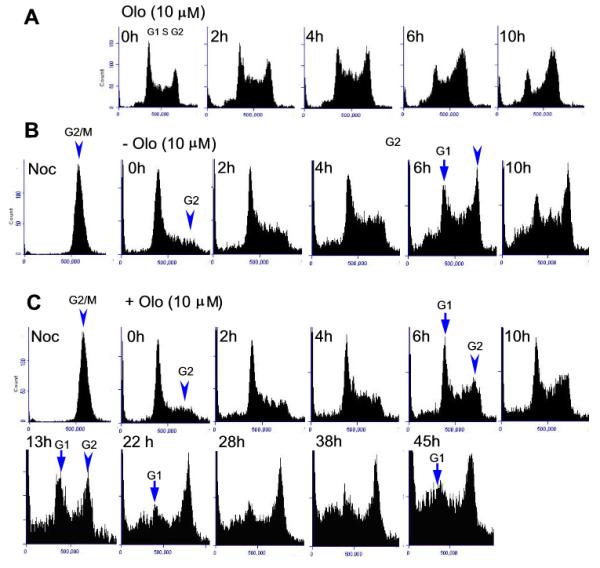
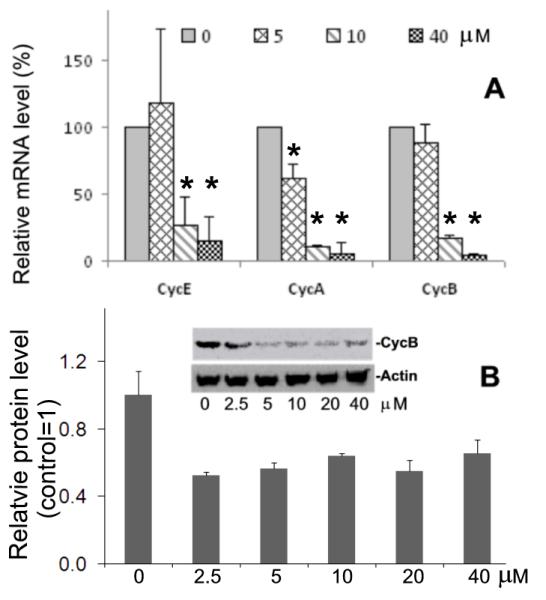
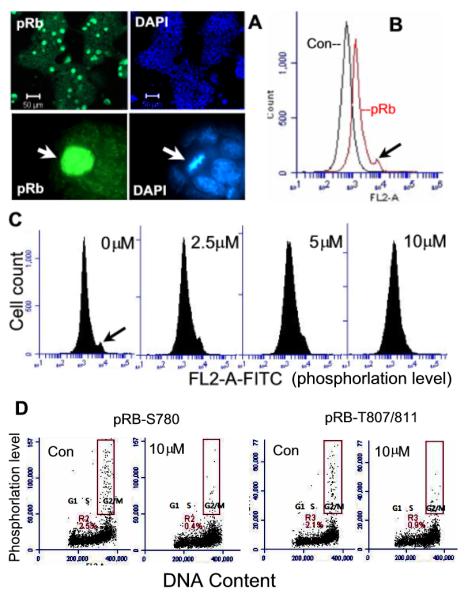
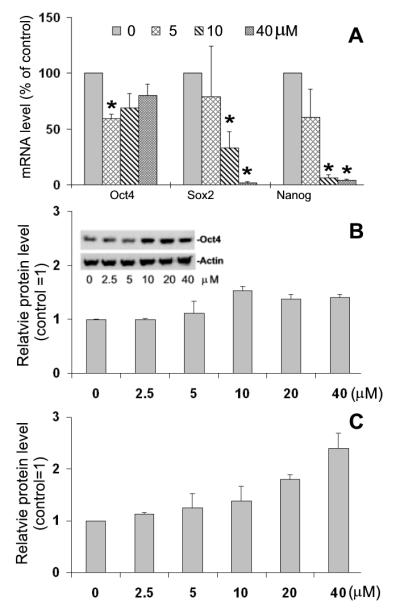
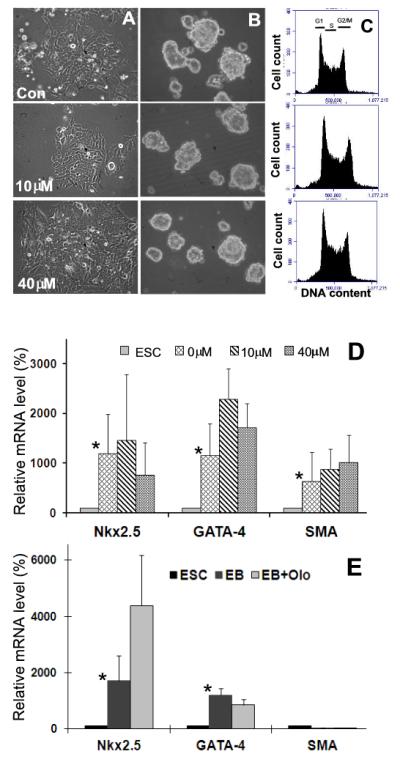
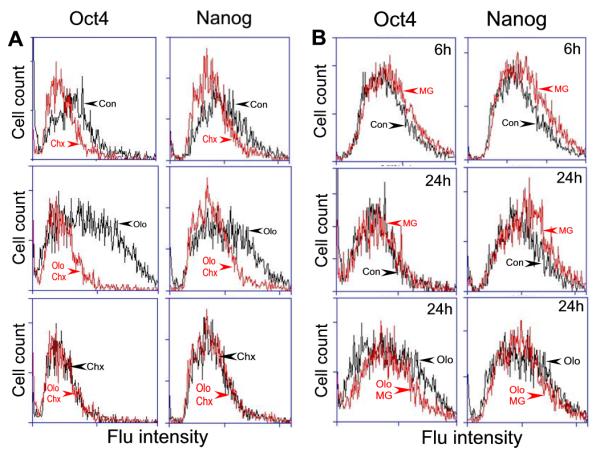
Embryonic stem cells (ESCs) have unlimited capacity for self-renewal and can differentiate into various cell types when induced. They also have an unusual cell cycle control mechanism driven by constitutively active cyclin dependent kinases (Cdks). In mouse ESCs (mESCs). It is proposed that the rapid cell proliferation could be a necessary part of mechanisms that maintain mESC self-renewal and pluripotency, but this hypothesis is not in line with the finding in human ESCs (hESCs) that the length of the cell cycle is similar to differentiated cells. Therefore, whether rapid cell proliferation is essential for the maintenance of mESC state remains unclear. We provide insight into this uncertainty through chemical intervention of mESC cell cycle. We report here that inhibition of Cdks with olomoucine II can dramatically slow down cell proliferation of mESCs with concurrent down-regulation of cyclin A, B and E, and the activation of the Rb pathway. However, mESCs display can recover upon the removal of olomoucine II and are able to resume normal cell proliferation without losing self-renewal and pluripotency, as demonstrated by the expression of ESC markers, colony formation, embryoid body formation, and induced differentiation. We provide a mechanistic explanation for these observations by demonstrating that Oct4 and Nanog, two major transcription factors that play critical roles in the maintenance of ESC properties, are up-regulated via de novo protein synthesis when the cells are exposed to olomoucine II. Together, our data suggest that short-term inhibition of cell proliferation does not compromise the basic properties of mESCs.
Copyright © 2012 Elsevier Inc. All rights reserved.
Figures
Similar articles
-
5-Aminoimidazole-4-carboxyamide ribonucleoside induces G(1)/S arrest and Nanog downregulation via p53 and enhances erythroid differentiation.Stem Cells. 2012 Feb;30(2):140-9. doi: 10.1002/stem.778. Stem Cells. 2012. PMID: 22076938 Free PMC article.
-
Icaritin enhances mESC self-renewal through upregulating core pluripotency transcription factors mediated by ERα.Sci Rep. 2017 Jan 16;7:40894. doi: 10.1038/srep40894. Sci Rep. 2017. PMID: 28091581 Free PMC article.
-
Effect of bisphenol A on pluripotency of mouse embryonic stem cells and differentiation capacity in mouse embryoid bodies.Toxicol In Vitro. 2013 Dec;27(8):2249-55. doi: 10.1016/j.tiv.2013.09.018. Epub 2013 Sep 30. Toxicol In Vitro. 2013. PMID: 24090592
-
Cell cycle and pluripotency: Convergence on octamer‑binding transcription factor 4 (Review).Mol Med Rep. 2017 Nov;16(5):6459-6466. doi: 10.3892/mmr.2017.7489. Epub 2017 Sep 13. Mol Med Rep. 2017. PMID: 28901500 Free PMC article. Review.
-
DNA repair mechanisms in embryonic stem cells.Cell Mol Life Sci. 2017 Feb;74(3):487-493. doi: 10.1007/s00018-016-2358-z. Epub 2016 Sep 10. Cell Mol Life Sci. 2017. PMID: 27614628 Free PMC article. Review.
Cited by
-
Mouse embryonic stem cells have underdeveloped antiviral mechanisms that can be exploited for the development of mRNA-mediated gene expression strategy.Stem Cells Dev. 2014 Mar 15;23(6):594-604. doi: 10.1089/scd.2013.0417. Epub 2013 Dec 20. Stem Cells Dev. 2014. PMID: 24219369 Free PMC article.
-
An extended model for culture-dependent heterogenous gene expression and proliferation dynamics in mouse embryonic stem cells.NPJ Syst Biol Appl. 2017 Aug 3;3:19. doi: 10.1038/s41540-017-0020-5. eCollection 2017. NPJ Syst Biol Appl. 2017. PMID: 28794899 Free PMC article.
-
Molecular Mechanisms Underlying Pluripotency and Self-Renewal of Embryonic Stem Cells.Int J Mol Sci. 2023 May 7;24(9):8386. doi: 10.3390/ijms24098386. Int J Mol Sci. 2023. PMID: 37176093 Free PMC article.
-
Antiviral responses in mouse embryonic stem cells: differential development of cellular mechanisms in type I interferon production and response.J Biol Chem. 2014 Sep 5;289(36):25186-98. doi: 10.1074/jbc.M113.537746. Epub 2014 Jun 25. J Biol Chem. 2014. PMID: 24966329 Free PMC article.
-
Wnt/Tcf1 pathway restricts embryonic stem cell cycle through activation of the Ink4/Arf locus.PLoS Genet. 2017 Mar 27;13(3):e1006682. doi: 10.1371/journal.pgen.1006682. eCollection 2017 Mar. PLoS Genet. 2017. PMID: 28346462 Free PMC article.
References
-
- Niwa H. How is pluripotency determined and maintained? Development. 2007;134:635–646. - PubMed
-
- Wobus AM, Boheler KR. Embryonic stem cells: prospects for developmental biology and cell therapy. Physiol.Rev. 2005;85:635–678. - PubMed
-
- Yu J, Vodyanik MA, Smuga-Otto K, Antosiewicz-Bourget J, Frane JL, Tian S, Nie J, Jonsdottir GA, Ruotti V, Stewart R, Slukvin II, Thomson JA. induced pluripotent stem cell lines derived from human somatic cells. Science. 2007;318:1917–1920. - PubMed
-
- Takumi M, Mattson M, Rao MS. Cellular lifespan and senescence signaling in embryonic stem cells. Aging Cell. 2008;3:333–343. - PubMed
Publication types
MeSH terms
Substances
Grants and funding
LinkOut - more resources
Full Text Sources
Research Materials
