Comparative Study
. 2012 Aug;78(16):5824-30.
doi: 10.1128/AEM.07869-11. Epub 2012 Jun 15.

Genotypic and phenotypic traits that distinguish neonatal meningitis-associated Escherichia coli from fecal E. coli isolates of healthy human hosts

Affiliations
Comparative Study

Genotypic and phenotypic traits that distinguish neonatal meningitis-associated Escherichia coli from fecal E. coli isolates of healthy human hosts

Catherine M Logue et al. Appl Environ Microbiol. 2012 Aug.

Abstract

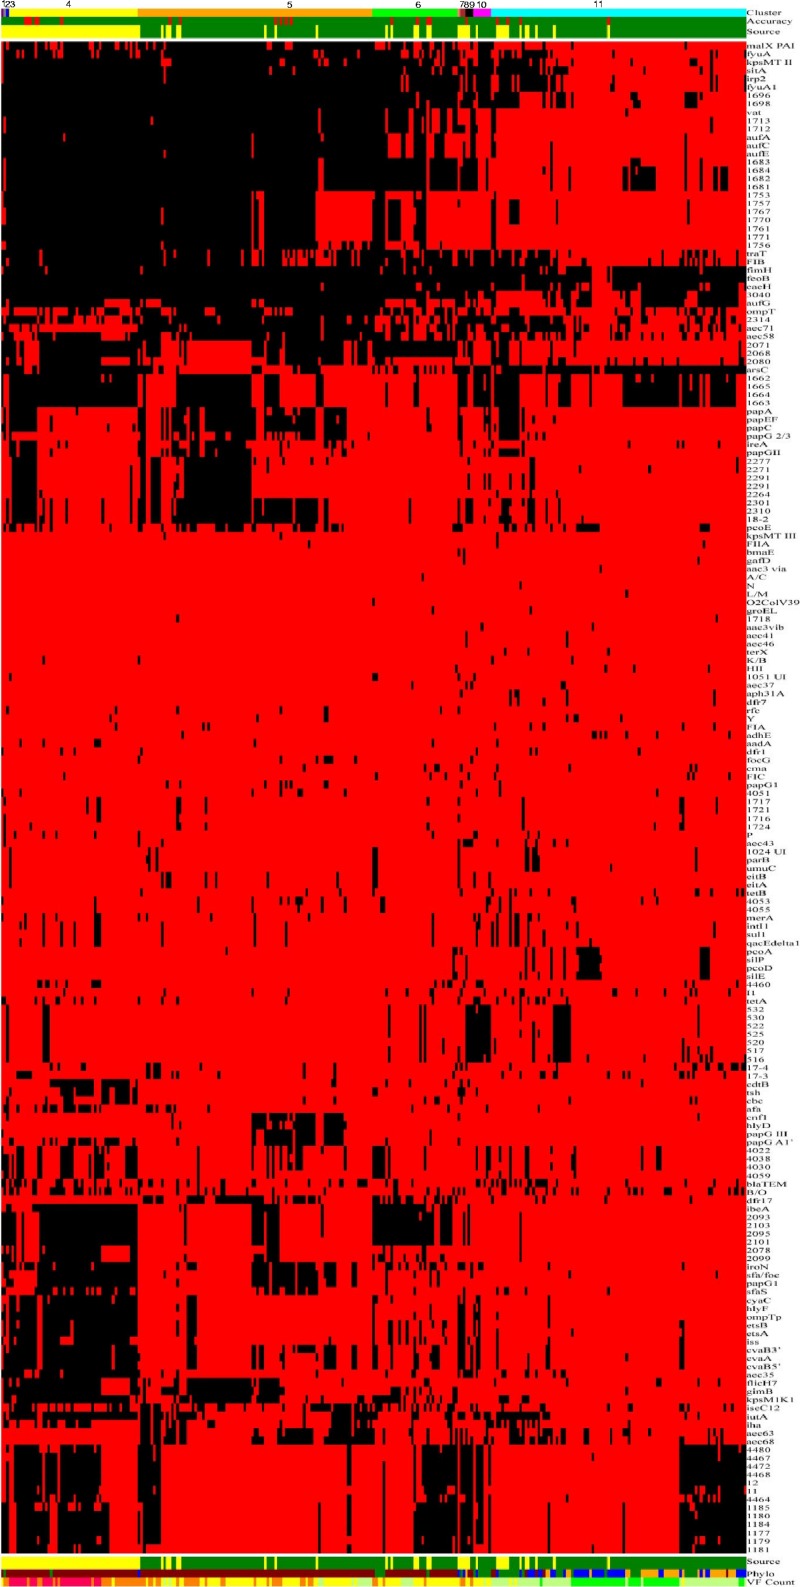
Neonatal meningitis Escherichia coli (NMEC) is one of the top causes of neonatal meningitis worldwide. Here, 85 NMEC and 204 fecal E. coli isolates from healthy humans (HFEC) were compared for possession of traits related to virulence, antimicrobial resistance, and plasmid content. This comparison was done to identify traits that typify NMEC and distinguish it from commensal strains to refine the definition of the NMEC subpathotype, identify traits that might contribute to NMEC pathogenesis, and facilitate choices of NMEC strains for future study. A large number of E. coli strains from both groups were untypeable, with the most common serogroups occurring among NMEC being O18, followed by O83, O7, O12, and O1. NMEC strains were more likely than HFEC strains to be assigned to the B2 phylogenetic group. Few NMEC or HFEC strains were resistant to antimicrobials. Genes that best discriminated between NMEC and HFEC strains and that were present in more than 50% of NMEC isolates were mainly from extraintestinal pathogenic E. coli genomic and plasmid pathogenicity islands. Several of these defining traits had not previously been associated with NMEC pathogenesis, are of unknown function, and are plasmid located. Several genes that had been previously associated with NMEC virulence did not dominate among the NMEC isolates. These data suggest that there is much about NMEC virulence that is unknown and that there are pitfalls to studying single NMEC isolates to represent the entire subpathotype.


Figures

Fig 1
Fig 1
Gel diagram merging the cluster analysis and LDA of the genotyping results of NMEC and HFEC strains. The first row (the uppermost row at the top of the figure) identifies the clusters to which the isolates were assigned based on their genotypes. There are 11 identified clusters: 1, magenta; 2, gray; 3, navy blue; 4, yellow; 5, orange; 6, lime green; 7, salmon; 8, brick red; 9, black; 10, bright pink; and 11, cyan. The second row shows the accuracy of prediction from the linear discriminant analysis (LDA) of an isolate type based on possession of genes/traits. Green indicates a correct prediction as to whether an isolate is an NMEC or an HFEC strain, whereas red indicates a misprediction, with 21 instances observed. The third row indicates the source of the isolates, where HFEC strains are denoted as green, and NMEC strains are identified in yellow. The next set of rows of red and black bars (rows 4 through 185; not numbered) shows the results for a single gene or trait. The identity of each gene tested is shown in the column at the far right of the diagram (below cluster, accuracy, and source). In the body of the figure, a black line means that the gene of interest is present in a particular isolate, whereas a red line means the gene is absent. The row following the black and red pattern (row 186) shows the source of the isolates (same as the third row from the top). Row 187 (made up of brown, green, blue, and orange colors) indicates the phylogenetic groups of each isolate: blue, phylogenetic group A; orange, B1; brown, B2; and green, D. Row 188 (the last row of the figure) indicates the gene/trait content for each strain, where isolates in category 1 contain 1 to 20 of the tested genes/traits and are identified as dark lime; category 2 isolates are identified in light lime and possess 20 to 40 genes; category 3 isolates are identified in yellow and possess 40 to 60 genes; category 4 isolates are identified in orange and possess 60 to 80 genes; and category 5 isolates are identified in bright pink and possess 80 to 100 genes. This figure is also available online at http://ecoli.cvm.iastate.edu:81/blast/images/Figure1nmec.jpg.

Similar articles

Cited by

References

    1. Anonymous 2009. National Antimicrobial Resistance Monitoring System—Enteric Bacteria (NARMS) 2009 annual report. Centers for Disease Control and Prevention, Atlanta, GA
    1. Anonymous 2010. SAS/STAT(R) 9.22 user's guide. SAS Institute Inc., Cary, NC
    1. Bailey JK, Pinyon JL, Anantham S, Hall RM. 2010. Distribution of human commensal Escherichia coli phylogenetic groups. J. Clin. Microbiol. 48:3455–3456 - PMC - PubMed
    1. Clermont O, Bonacorsi S, Bingen E. 2000. Rapid and simple determination of the Escherichia coli phylogenetic group. Appl. Environ. Microbiol. 66:4555–4558 - PMC - PubMed
    1. Croxen MA, Finlay BB. 2010. Molecular mechanisms of Escherichia coli pathogenicity. Nat. Rev. Microbiol. 8:26–38 - PubMed

Publication types

MeSH terms