. 2012 Jul 15;189(2):755-66.
doi: 10.4049/jimmunol.1200162. Epub 2012 Jun 15.

Tim-3 pathway controls regulatory and effector T cell balance during hepatitis C virus infection

Affiliations

Tim-3 pathway controls regulatory and effector T cell balance during hepatitis C virus infection

Jonathan P Moorman et al. J Immunol. .

Abstract

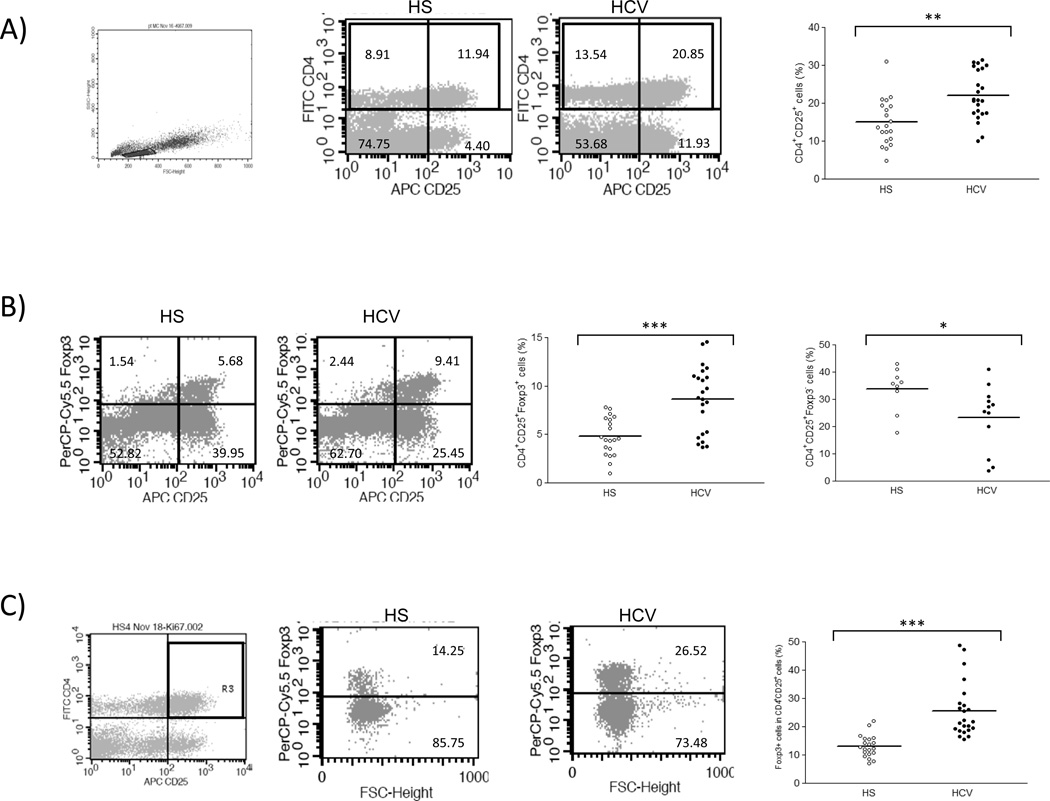
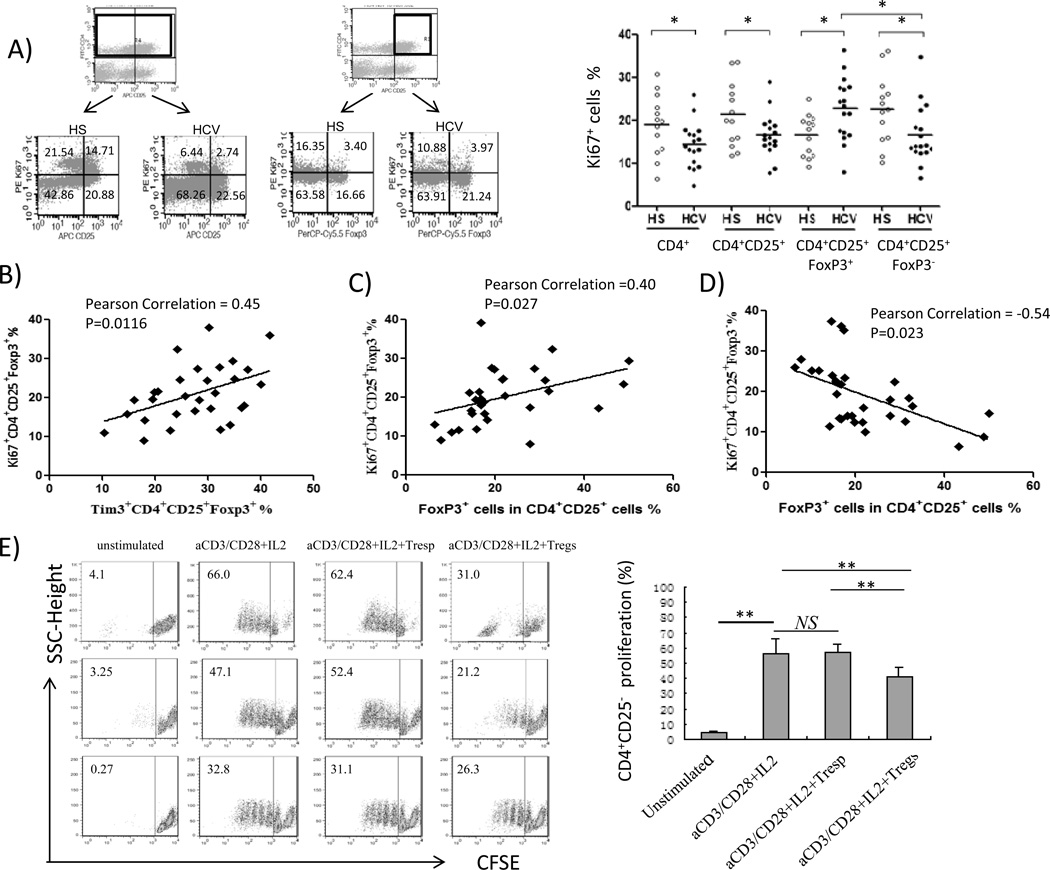
Hepatitis C virus (HCV) is remarkable at disrupting human immunity to establish chronic infection. Upregulation of inhibitory signaling pathways (such as T cell Ig and mucin domain protein-3 [Tim-3]) and accumulation of regulatory T cells (Tregs) play pivotal roles in suppressing antiviral effector T cell (Teff) responses that are essential for viral clearance. Although the Tim-3 pathway has been shown to negatively regulate Teffs, its role in regulating Foxp3(+) Tregs is poorly explored. In this study, we investigated whether and how the Tim-3 pathway alters Foxp3(+) Treg development and function in patients with chronic HCV infection. We found that Tim-3 was upregulated, not only on IL-2-producing CD4(+)CD25(+)Foxp3(-) Teffs, but also on CD4(+)CD25(+)Foxp3(+) Tregs, which accumulate in the peripheral blood of chronically HCV-infected individuals when compared with healthy subjects. Tim-3 expression on Foxp3(+) Tregs positively correlated with expression of the proliferation marker Ki67 on Tregs, but it was inversely associated with proliferation of IL-2-producing Teffs. Moreover, Foxp3(+) Tregs were found to be more resistant to, and Foxp3(-) Teffs more sensitive to, TCR activation-induced cell apoptosis, which was reversible by blocking Tim-3 signaling. Consistent with its role in T cell proliferation and apoptosis, blockade of Tim-3 on CD4(+)CD25(+) T cells promoted expansion of Teffs more substantially than Tregs through improving STAT-5 signaling, thus correcting the imbalance of Foxp3(+) Tregs/Foxp3(-) Teffs that was induced by HCV infection. Taken together, the Tim-3 pathway appears to control Treg and Teff balance through altering cell proliferation and apoptosis during HCV infection.


Figures

Fig. 1
Fig. 1. Accumulation of CD4+CD25+Foxp3+ Tregs in chronic HCV infection
A) Flow cytometric analyses of PBMCs from healthy subjects (HS) and chronically HCV-infected patients (HCV), stained with conjugated mAbs: FITC-CD4, APC-CD25, and PerCP-Cy5.5-Foxp3. The cells were first gated on lymphocyte populations and then further gated on CD4+ T cells, with frequency of cells in each quadrant indicated in the representative dot plots. Summary percentages of CD4+CD25+ T cells detected in the gated populations of HS and HCV is shown on the right panel. Each symbol represents a single individual, and the horizontal bars represent median values. The p value (**<0.01) is denoted above the group of studied subjects. B) Representative dot plots of Foxp3 expression in CD4+CD25+ T cell populations, gated based on isotype and FMO controls, in HS and HCV are shown on the left panel. Summary data for the difference of CD4+CD25+Foxp3+ Tregs and CD4+CD25+Foxp3 Teffs in HS versus HCV are shown on the right panels. *P< 0.05, ***P< 0.001. C) The relative frequency of Foxp3+ cells in CD4+CD25+ T cell populations. The cells were gated on CD4+CD25+ T cells, and the ratio of Foxp3+ cells in CD4+CD25+ T cells from HS and HCV are shown. ***P < 0.001.
Fig. 2
Fig. 2. Upregulation of Tim-3 on CD4+CD25+Foxp3+ Tregs in chronic HCV infection
A) Flow cytometry analyses of PBMCs from HS and HCV, stained with conjugated mAbs: FITC-CD4, APC-CD25, PerCP-Cy5.5-Foxp3, and PE-Tim-3. The cells were gated on CD4+ T cells (dot plot upper column) and CD4+CD25+ subpopulations (dot plot upper right column for Foxp3+/− cell analysis) with frequency in each quadrant indicated in the representative dot plots; and summary data of Tim-3 expression on CD4+, CD4+CD25+, CD4+CD25+Foxp3+ Tregs, and CD4+CD25+Foxp3 Teffs examined in HS and HCV, calculated based on each specific cell populations, is shown below. Each symbol represents a single individual, and the horizontal bars represent median values. *P< 0.05, **P< 0.01. NS = no significance. B) Summary data (mean ± SD) of mean fluorescence intensity (MFI) of Tim-3 expression on CD4+CD25+Foxp3+ Tregs and CD4+CD25+Foxp3 Teffs from HS versus HCV patients. *P<0.05, **P<0.01. C) Correlation analysis between Foxp3 expression in CD4+CD25+ cells and Tim-3 expression on CD4+CD25+Foxp3+ Tregs in HCV-infected individuals. Pearson correlation and P values are shown above.
Fig. 3
Fig. 3. Upregulation of Tim-3 on CD4+CD25+Foxp3+ Tregs positively correlates with the expression of Ki67 on Tregs in chronic HCV infection
A) Flow cytometry analyses of PBMCs from HS and HCV, stained with conjugated mAbs: FITC-CD4, APC-CD25, PerCP-Cy5.5-Foxp3, and PE-Ki67. The cells were gated on CD4+ and CD4+CD25+ T cells with frequency indicated in each quadrant of representative dot plots; and summary data of Ki67 expression on CD4+, CD4+CD25+, CD4+CD25+Foxp3+ Tregs, and CD4+CD25+Foxp3 Teffs detected in HS and HCV are shown on the right. Each symbol represents a single individual, and the horizontal bars represent median values. *P<0.05. B) The correlation analysis between Ki67 and Tim-3 expressions in CD4+CD25+Foxp3+ Tregs in HS and HCV-infected individuals. Pearson correlation and P values are shown above. C) Ki67 expression by CD4+CD25+Foxp3+ Tregs positively correlated to the frequency of Foxp3 expression by CD4+CD25+ cells. D) Ki67 expression by CD4+CD25+Foxp3 Teffs inversely correlated with Foxp3 expression by CD4+CD25+ Tregs. E) Functional analysis of CD4+CD25+ T cells in suppression of CD4+CD25 T cell proliferation. CD4+CD25 T cells were isolated from HCV-infected individuals, labeled with CFSE, and then stimulated without or with anti-CD3/CD28 + IL-2 alone and in co-culture with purified CD4+CD25 T responder cells (Tresp) or CD4+CD25+ Treg-containing cells (1:1 ratio) for 6 days, followed by analysis of CFSE dilution as a means to measure T cell proliferation. Representative dot plots of cells from three HCV-infected patients under various treatments are shown on the left panel, and summary data of CFSE-labeled T cell proliferation from 8 HCV patients are shown on the right. **P<0.01. NS=no significance.
Fig. 4
Fig. 4. Upregulation of Tim-3 on CD4+CD25+Foxp3+ Tregs inversely correlates with the inhibition of IL-2-producing CD4+CD25+Foxp3 Teffs in chronic HCV infection
A) Representative dot plots of PBMCs stained with FITC-CD4, APC-CD25, PerCP-Cy5.5-Foxp3, and PE-IL-2. The cells were gated on CD4+CD25+ T cells (upper right column) and IL-2 expression, primarily by Foxp3 Teffs, in HS versus HCV are shown. Summary data for comparison the frequency of IL-2-expressing cells in CD4+, CD4+CD25+, and CD4+CD25+Foxp3 Teffs in HS and HCV subjects is shown on the right. Each symbol represents a single individual, and the horizontal bars represent median values. *P< 0.05. B) Representative zebra plots of purified CD4+ T cells stained with FITC-CD25, APC-Tim-3, PerCP-Cy5.5-Foxp3, and PE-IL-2. The cells were gated on CD25+ T cells, and IL-2 expression, primarily by Foxp3 Teffs as shown in the upper panel, in Tim-3+ and Tim-3 cells from HS and HCV are shown below. Summary data of IL-2 expression by Tim-3+ versus Tim-3 Teffs from 8 HS and 8 HCV patients are shown on the right. **P<0.01; ***P<0.001. C) Correlation analysis between Tim-3 and IL-2 expressions by CD4+CD25+Foxp3 Teffs using purified CD4+ T cells from HS and HCV-infected individuals. D) Correlation analysis between IL-2 expression by CD4+CD25+Foxp3 Teffs and Tim-3 expression on CD4+CD25+Foxp3+ Tregs using purified CD4+ T cells from HS and HCV-infected individuals. Pearson correlation and P values are shown above.
Fig. 5
Fig. 5. Foxp3+ Tregs are resistant, while IL-2-producing Foxp3 Teffs sensitive to, TCR activation-mediated apoptosis that is reversible by Tim-3 blockade
A) Dose- and cell-dependent apoptosis induced by TCR stimulation. PBMCs from HCV-infected patients were stimulated with anti-CD3 and anti-CD28 at 0, 2, and 5 µg/ml of each for 48 h, stained with FITC-CD4, APC-CD25, PerCP-Cy5.5-Foxp3, and PE-Annexin-V, followed by flow cytometric analysis. The cells were gated on CD4+CD25+ T cell populations and then Foxp3+ Tregs (upper panel) and Foxp3 Teffs (lower panel), based on the isotype controls. The frequency of Annexin-V+ cells in the gated CD4+CD25+Foxp3+ Tregs or CD4+CD25+Foxp3 Teffs is indicated in the right upper corner. B) Representative dot blots of Annexin-V expression on CD4+CD25+FoxP3+ Tregs (upper panel) and CD4+CD25+FoxP3 Teffs (lower panel) by stimulation of purified CD4+CD25+ T cells from chronic HCV patients with varying doses of anti-CD3/CD28, followed by flow cytometric analysis of apoptosis as described above. The data are reproducible using purified cells from multiple HS and HCV. C) Tim-3 blockade lead to a decrease of apoptosis of purified CD4+CD25+ T cells from HCV patients. Purified CD4+CD25+ T cells from HCV-infected patients were pretreated with anti-Tim-3 or control IgG overnight, and then stimulated with anti-CD3/CD28 (2 µg/ml) for 48 h, followed by flow cytometric analysis of Annexin-V expression on CD4+CD25+FoxP3+ Tregs (upper panel) and CD4+CD25+ FoxP3 Teffs (lower panel). Summary data obtained from 8 HCV-infected patients are shown in the right panel. **P<0.01. D) Tim-3 blockade reduced apoptosis of IL-2-producing Foxp3 Teffs. Purified CD4+CD25+ T cells from HCV-infected patients were pretreated with anti-Tim-3 or control IgG overnight and then stimulated with anti-CD3/CD28 (2 µg/ml) for 48 h, followed by immunostaining and flow cytometric analysis of Annexin-V expression on IL-2 Foxp3+ Tregs (upper panel) and IL-2+ FoxP3 Teffs (lower panel). Summary data collected from 8 HCV-infected patients are shown in the right panel. **P<0.01.
Fig. 6
Fig. 6. Tim-3 blockade differentially promotes proliferation of Foxp3+ Tregs and Foxp3 Teffs through improving the phosphorylation of STAT-5 in CD4+CD25+ T cells from HCV patients
A) Tim-3 blockade on CD4+CD25+ T cells enhances Foxp3+ Treg expansion. Left panel, single representative dot plots of CFSE-labeled CD4+CD25+ T cells from HCV-infected patients that were pretreated with a control IgG or anti-Tim-3 overnight, then stimulated without or with anti-CD3/CD28 (1 µg/ml) and IL-2 (50U/ml) for 6 d; the cells were double-stained with Foxp3 and CFSE dilutions in Foxp3+ Tregs are shown. Right panel, summary data of proliferation of CD4+CD25+Foxp3+ Tregs from 8 HCV-infected patients under various ex vivo treatments. *P<0.05, **P<0.01. B) Tim-3 blockade improves the phosphorylation of STAT-5 in CD4+CD25+ T cells from HCV-infected patients. The purified CD4+CD25+ T cells from HCV-infected individuals were pretreated with a control IgG or anti-Tim-3 antibody overnight and then stimulated with anti-CD3/CD28 (1 µg/ml) and IL-2 (50U/ml) for 6 h, followed by Western blot to detect pSTAT-5 and total STAT-5. Densitometry data of phosphorylated STAT-5, normalized by total STAT-5 as loading control, from 3 HCV-infected patients is shown below. **P<0.01. C) Tim-3 blockade on CD4+ T cells ex vivo promotes expansion of Foxp3 Teffs more substantially, thus correcting the imbalance of Foxp3+ Tregs/Foxp3 Teffs established during chronic HCV infection. Purified CD4+ T cells were treated as described in A), and summary data of the Foxp3+ Tregs/Foxp3 Teffs ratio changes under various treatments using purified CD4+ T cells from 8 HCV-infected patients is shown. **P<0.01. D) Tim-3 blockade on CD4+ T cells reduces the ratio of CD25+Foxp3+ Tregs in the CD4+ T cells from HS and HCV-infected individuals. The purified CD4+ T cells were pretreated with a control IgG or anti-Tim-3 overnight, and then stimulated with anti-CD3/CD28 (1 µg/ml) for 48 h, followed by flow cytometric analysis of Foxp3 expression in CD25+ T cells. Summary data of CD25+Foxp3+ Tregs in the purified CD4+ T cells under various treatments from 8 HS and 8 HCV-infected patients is shown in the right panel. **P<0.01.
Fig. 7
Fig. 7. A model for Tim-3/Gal-9 interactions in regulating the HCV-mediated imbalance of Foxp3+ Tregs/Foxp3 Teffs during HCV infection
Our data support the proposed notion that HCV infection up-regulates the expression of Tim-3 and accumulation of Foxp3+ Tregs, inhibiting Foxp3 Teff responses and resulting in blunted antiviral T cell responses with decreased pro-inflammatory cytokines and increased anti-inflammatory cytokines that contribute to viral persistence. Specifically, HCV-mediated Tim-3 inhibit proliferation and induce apoptosis of activated CD25+Foxp3 Teffs, leading to impaired protective Th1 responses as well as limited pathogenic injury. Meanwhile, as a negative feedback mechanism, Tim-3 is also up-regulated and tempers CD25+Foxp3+ Tregs, which accumulate during HCV infection and may further dampen antiviral T cell responses. Notably, Tim-3 pathway fine-tunes the development and function of Foxp3+ Tregs and blocking Tim-3 signaling may correct the imbalance of Foxp3+ Tregs/Foxp3 Teffs established during HCV infection. Therefore, the counter-regulatory effect of Tim-3 on Tregs should be taken into account when manipulating this inhibitory pathway as a novel strategy for immunotherapy against chronic viral infection, so as to balance the protective immune responses and avoid T cell-dependent injury.

Similar articles

Cited by

References

    1. Shepard CW, Finelli L, Alter MJ. Global epidemiology of hepatitis C virus infection. Lancet Infect Dis. 2005;5:558–567. - PubMed
    1. Walker CM. Adaptive immunity to the hepatitis C virus. Adv. Virus Res. 2010;78:43–86. - PMC - PubMed
    1. Hori S, Nomura T, Sakaguchi S. Control of regulatory T cell development by the transcription factor Foxp3. Science. 2003;299:1057–1061. - PubMed
    1. Baecher-Allan C, Brown JA, Freeman GJ, Hafler DA. CD4+CD25high regulatory cells in human peripheral blood. J Immunol. 2001;167:1245–1253. - PubMed
    1. Belkaid Y, Chen W. Regulatory ripples. Nat Immunol. 2010;11:1077–1078. - PMC - PubMed

Publication types

MeSH terms

Substances