. 2012 Jun 17;13(8):729-36.
doi: 10.1038/ni.2352.

The Ets transcription factor Spi-B is essential for the differentiation of intestinal microfold cells

Affiliations

The Ets transcription factor Spi-B is essential for the differentiation of intestinal microfold cells

Takashi Kanaya et al. Nat Immunol. .

Abstract

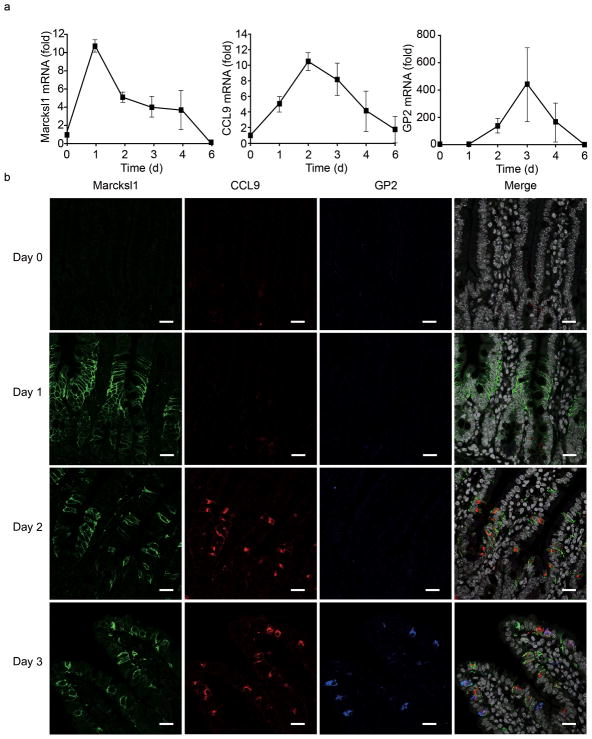
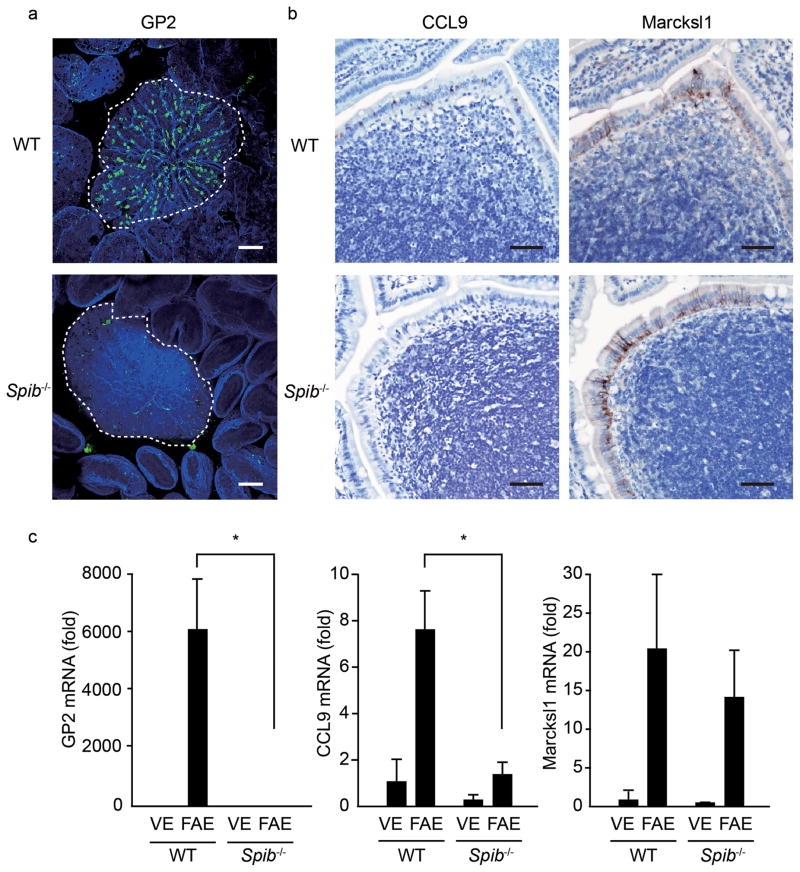
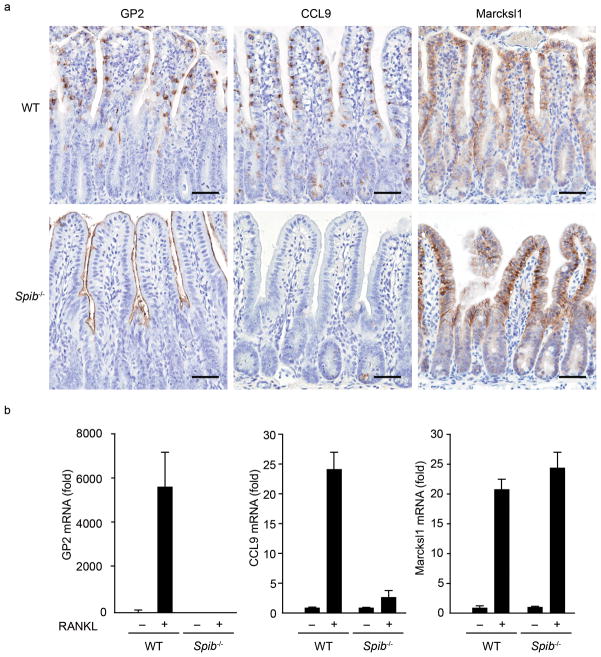
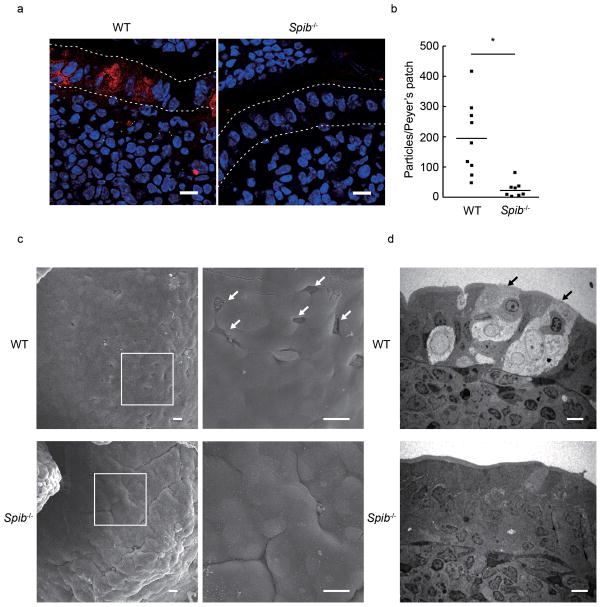
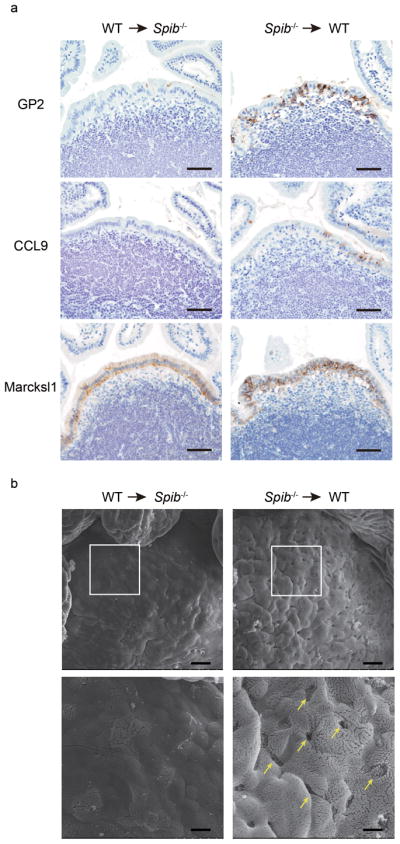
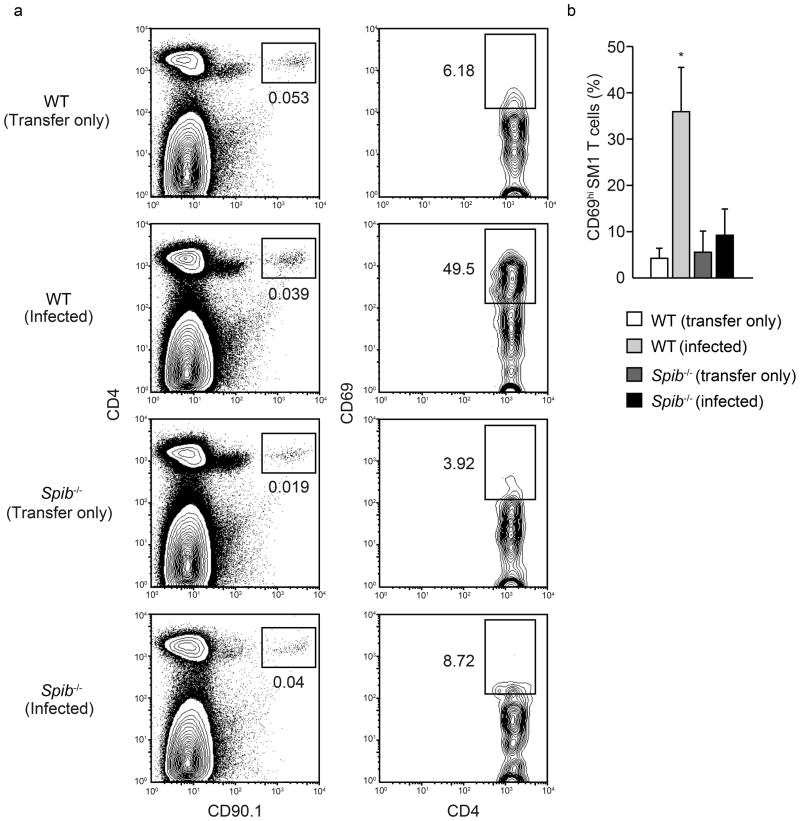
Intestinal microfold cells (M cells) are an enigmatic lineage of intestinal epithelial cells that initiate mucosal immune responses through the uptake and transcytosis of luminal antigens. The mechanisms of M-cell differentiation are poorly understood, as the rarity of these cells has hampered analysis. Exogenous administration of the cytokine RANKL can synchronously activate M-cell differentiation in mice. Here we show the Ets transcription factor Spi-B was induced early during M-cell differentiation. Absence of Spi-B silenced the expression of various M-cell markers and prevented the differentiation of M cells in mice. The activation of T cells via an oral route was substantially impaired in the intestine of Spi-B-deficient (Spib(-/-)) mice. Our study demonstrates that commitment to the intestinal M-cell lineage requires Spi-B as a candidate master regulator.


Figures

Figure 1
Figure 1. Distinct expression patterns of M-cell markers in mouse villous epithelium after RANKL-treatment
(a) The expression of M-cell markers in mouse intestinal epithelial cells after GST-RANKL treatment was assessed by qPCR. RANKL injections were given twice a day for up to 4 days followed by 2 days without further RANKL treatment. Intestinal epithelial cells were isolated from the ileum at 1, 2, 3, 4 and 6 days after the initial RANKL treatment for qPCR analysis. Data represent fold change compared to the normalized value of expression of each transcript in epithelial cells from untreated mice. All samples were normalized to the expression level of GAPDH (n = 3). (b) Small intestinal tissues from RANKL-treated mice were stained with antibodies for M-cell markers (Supplementary Table 1). All sections were counterstained with DAPI. Scale bar: 20 μm. Data are representative of three independent experiments (error bars, s.d.)
Figure 2
Figure 2. Preferential expression of Spi-B transcript in mouse M cells
(a) The kinetics of Spi-B expression after RANKL-treatment was assessed by qPCR. Data represent fold change compared to the normalized value of expression of each transcript in epithelial cells from untreated mice. (b) Spi-B mRNA expression was measured by qPCR in villous epithelium (VE) and follicle-associated epithelium (FAE). Data represent fold change compared to the normalized value of expression of each transcript in villous epithelial cells. All samples were normalized to the expression level of GAPDH (n = 3). (c) In situ hybridization (ISH) analysis of Spi-B mRNA in the small intestine from RANKL-treated and untreated mice. Scale bar: 50 μm. (d) The top panel shows ISH image of Spi-B mRNA in a PP follicle. Scale bar: 100 μm. Lower three panels show the high magnification images of box in the top panel, after restaining of the section with UEA-I. Dotted lines represent FAE. Arrows indicate the double positive cells with Spi-B and UEA-I. Asterisks indicate goblet cells on adjacent villous epithelium, which are also positive for UEA-I. Scale bar: 20 μm. (e) Top panel shows immunostaining of Spi-B (red) in small intestine from mouse after 18 hours after RANKL-treatment. Lower three panels show dual staining of Spi-B (red) and GP2 (green). Arrows indicate Spi-B+GP2+ cells. All sections were counterstained with DAPI. Scale bar: 20 μm. (f) ISH of Spi-B mRNA in a PP from 18.5 day old wild-type mouse embryo is shown (top panel). Spi-B mRNA was also expressed in other GALT, such as ILFs, colonic patches and cecal patches (lower three panels). Scale bar: 50 μm. Data are representative of three independent experiments (error bars, s.d.).
Figure 3
Figure 3. The expression of M cell-markers in Spib−/− mice
(a) Whole mount GP2 staining of PPs from Spib−/− and wild-type mice was performed. GP2 was visualized with Alexa 488 anti-rat IgG (green). F-actin was stained with Alexa 647 Phalloidin (blue). Dotted lines depict the position of FAE. Scale bar: 80 μm. (b) Expression of CCL9 and Marcksl1 in mouse FAE was analyzed by immunohistochemistry. Scale bar: 50 μm. (c) Comparison of M-cell marker expression in FAE and VE between wild-type and Spib−/− mice by qPCR analysis. Data represent fold change compared to the normalized value of expression of each transcript in villous epithelial cells from wild-type mice. All samples were normalized to the expression level of GAPDH. Data are representative of three independent experiments (error bars, s.d.). *, P<0.01.
Figure 4
Figure 4. RANKL-induced M-cell differentiation in Spib−/− mice
(a) Small intestines were dissected from wild-type and Spib−/− mice after 3 days of RANKL-treatment, and subjected to immunohistochemistry. The upper three panels show the immunostaining of M-cell markers GP2, CCL9 and Marcksl1 in wild-type mice, and the lower three panels show those in Spib−/− mice. Scale bar: 50 μm. (b) Quantitative analysis of M-cell marker expression by qPCR. Data represent fold change compared to the normalized value of expression of each transcript in villous epithelial cells from untreated wild-type mice. All samples were normalized to the expression level of GAPDH. Data are representative of two independent experiments (error bars, s.d.).
Figure 5
Figure 5. Disappearance of functional M cells in Spib−/− mice
(a) Green fluorescent 200 nm diameter nanoparticles were orally administered to the mice. Three hours later, the distal three PPs were isolated, embedded into OCT-compound, and the sections were stained with DAPI (blue). GP2 was visualized with Dylight549-labeled secondary Ab (red). Dotted lines depict the position of FAE. Scale bar: 10 μm. (b) The number of nanoparticles was counted in 20 serial sections per PP, and were represented in lower graph. Statistical analysis was performed by Student’s t-test (n = 9, P = 0.0269). (c) SEM images of PPs from wild-type mice (upper panels) and Spib−/− mice (lower panels) are shown. Left panels show low magnification images, with the boxed areas shown at higher magnification in right panels. Scale bar = 20 μm. (d) TEM images of PPs from wild-type mice (upper) and Spib−/− mice (lower) are shown. Scale bar: 5 μm. Arrows in (c) and (d) indicate typical M cells, with sparse and irregular microvilli and basolateral pocket-like structure. Data are representative of two independent experiments (error bars, s.d.)
Figure 6
Figure 6. The maturation of M cells in Spib−/− bone marrow chimeric mice
(a) Bone marrow (BM) cells from wild-type (CD45.1) mice were transferred into irradiated Spib−/− (CD45.2) mice (WT → Spib−/−, left column), or vice versa (Spib−/−→ WT, right column). Eight weeks after the transfer, PPs were immunostained with M-cell markers: GP2, CCL9, and Marcksl1, as described in the Experimental Procedures. Scale bar: 50 μm. (b) SEM images of PPs from BM chimeric Spib−/− mice (WT → Spib−/−, left column) and BM chimeric wild-type mice (Spib−/−→ WT, right column) are shown. Lower panels show enlarged images of squares in upper panels. Scale bar = 20 μm (upper), 6 μm (lower). Data are representative of two independent experiments.
Figure 7
Figure 7. Defect in Salmonella-specific T-cell activation in Spib−/− mice
(a) Wild-type or Spib−/− mice were adoptively transferred with SM1 T cells, and orally inoculated with S. Typhimurium at 24 hours after transfer. Left panels depict dot plots of CD90.1 and CD4 expression on PP cells from uninfected (Transfer only) and infected (Infected) mice at 24 hours after infection. Rectangles in the left panels indicate the gate for CD90.1+ SM1 cells. Figures under the rectangles are the percentage of the gated cells in the total cells. Right panels depict contour plots of CD4 and CD69 expression on the cells in the gate of the left panels. Rectangles in the right panels indicate the CD69+ activated cells among the gated SM1 cells. Figures are the percentage of the gated cells among all SM1 cells. (b) Plot shows CD69 activation data from four independent experiments. Error bar indicates s.d. *, P<0.01.

References

    1. Kraehenbuhl JP, Neutra MR. Epithelial M cells: differentiation and function. Annu Rev Cell Dev Biol. 2000;16:301–332. - PubMed
    1. Neutra MR, Mantis NJ, Kraehenbuhl JP. Collaboration of epithelial cells with organized mucosal lymphoid tissues. Nat Immunol. 2001;2:1004–1009. - PubMed
    1. Neutra MR, Frey A, Kraehenbuhl JP. Epithelial M cells: gateways for mucosal infection and immunization. Cell. 1996;86:345–348. - PubMed
    1. Bockman DE, Cooper MD. Pinocytosis by epithelium associated with lymphoid follicles in the bursa of Fabricius, appendix, and Peyer’s patches. An electron microscopic study. Am J Anat. 1973;136:455–477. - PubMed
    1. Owen RL, Jones AL. Epithelial cell specialization within human Peyer’s patches: an ultrastructural study of intestinal lymphoid follicles. Gastroenterology. 1974;66:189–203. - PubMed

Publication types