. 2012 Jul;4(7):795-804.
doi: 10.1039/c2ib00136e. Epub 2012 Jun 18.

DEFOG: discrete enrichment of functionally organized genes

Affiliations

DEFOG: discrete enrichment of functionally organized genes

Tobias Wittkop et al. Integr Biol (Camb). 2012 Jul.

Abstract

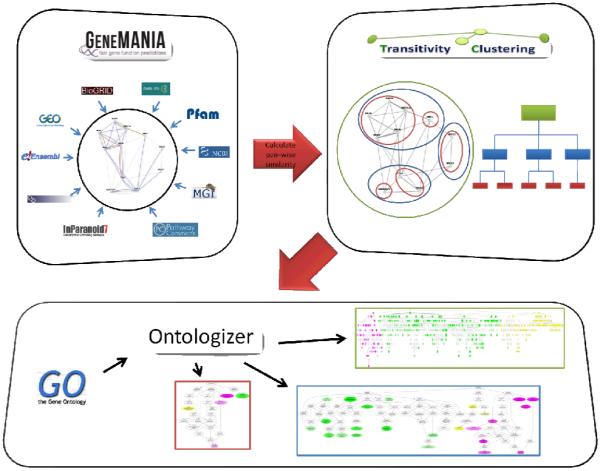
High-throughput biological experiments commonly result in a list of genes or proteins of interest. In order to understand the observed changes of the genes and to generate new hypotheses, one needs to understand the functions and roles of the genes and how those functions relate to the experimental conditions. Typically, statistical tests are performed in order to detect enriched Gene Ontology categories or pathways, i.e. the categories are observed in the genes of interest more often than is expected by chance. Depending on the number of genes and the complexity and quantity of functions in which they are involved, such an analysis can easily result in hundreds of enriched terms. To this end we developed DEFOG, a web-based application that facilitates the functional analysis of gene sets by hierarchically organizing the genes into functionally related modules. Our computational pipeline utilizes three powerful tools to achieve this goal: (1) GeneMANIA creates a functional consensus network of the genes of interest based on gene-list-specific data fusion of hundreds of genomic networks from publicly available sources; (2) Transitivity Clustering organizes those genes into a clear hierarchy of functionally related groups, and (3) Ontologizer performs a Gene Ontology enrichment analysis on the resulting gene clusters. DEFOG integrates this computational pipeline within an easy-to-use web interface, thus allowing for a novel visual analysis of gene sets that aids in the discovery of potentially important biological mechanisms and facilitates the creation of new hypotheses. DEFOG is available at http://www.mooneygroup.org/defog.


Figures

Fig 1
Fig 1
The DEFOG workflow. First, GeneMANIA assembles biological networks from multiple sources and combines them into a consensus gene similarity network. Second, hierarchical clustering is performed using Transitivity Clustering. Finally, Ontologizer is applied to detect statistically overrepresented gene ontology terms in each cluster. Colors represent different levels of specificity.
Fig. 2
Fig. 2
Use-case clustering graphs from the output of DEFOG. A) represents the cluster graph from use-case #1 (HTT primaries) run with the default DEFOG settings. B) represents the same data as A, but with the clustering levels changed from 10 to 20. C) shows the resulting graph from running use-case #2 (GenAge) through DEFOG, with the clustering levels set to 5. Darker shaded, larger nodes represent larger clusters, with numbers representing the size of a cluster, i.e. the number of genes in that cluster. Gene groups with less than 5 genes are excluded from this graphical representation (default setting for DEFOG). Asterisks indicate nodes focused on for analysis and red numbers are specific markers for extended discussion.
Fig 3
Fig 3
GeneMANIA analysis of the genes from a cluster with 7 genes (Fig 2a:*) in use-case #1, HPRD HTT PPI. The seven genes (nodes) were represented were connected by functional similarity information (edges) from the GeneMANIA networks. Edge colors represent the following: blue – physical interactions, violet – co-expression data, magenta – co-localization, orange – predicted interactions, and green – pathways. Increasing edge thickness represents increasing similarity as defined by GeneMANIA’s normalized maximum weight.
Fig 4
Fig 4
Visualization of the HTT primary interacting proteins from HPRD that were used as use-case #1 for DEFOG. Nodes are proteins, and edges are similarity as defined in the consensus network within GeneMANIA. Edge thickness represents the degree of similarity between linked nodes, such that thickness increases as similarity increases.

Similar articles

Cited by

References

    1. Ashburner M, Ball CA, Blake JA, Botstein D, Butler H, Cherry JM, Davis AP, Dolinski K, Dwight SS, Eppig JT, Harris MA, Hill DP, Issel-Tarver L, Kasarskis A, Lewis S, Matese JC, Richardson JE, Ringwald M, Rubin GM, Sherlock G. Nat. Genet. 2000;25:25–29. - PMC - PubMed
    1. Maere S, Heymans K, Kuiper M. Bioinformatics. 2005;21:3448–3449. - PubMed
    1. Zheng Q, Wang XJ. Nucleic Acids Res. 2008;36:W358–63. - PMC - PubMed
    1. Sealfon RSG, Hibbs MA, Huttenhower C, Myers CL, Troyanskaya OG. BMC Bioinformatics. 2006;7:443. - PMC - PubMed
    1. Huang DW, Sherman BT, Lempicki RA. Nat Protoc. 2009;4:44–57. - PubMed

Publication types