. 2012 Oct;60(10):1451-67.
doi: 10.1002/glia.22365. Epub 2012 Jun 17.

Laminin regulates postnatal oligodendrocyte production by promoting oligodendrocyte progenitor survival in the subventricular zone

Affiliations

Laminin regulates postnatal oligodendrocyte production by promoting oligodendrocyte progenitor survival in the subventricular zone

Jenne Relucio et al. Glia. 2012 Oct.

Abstract

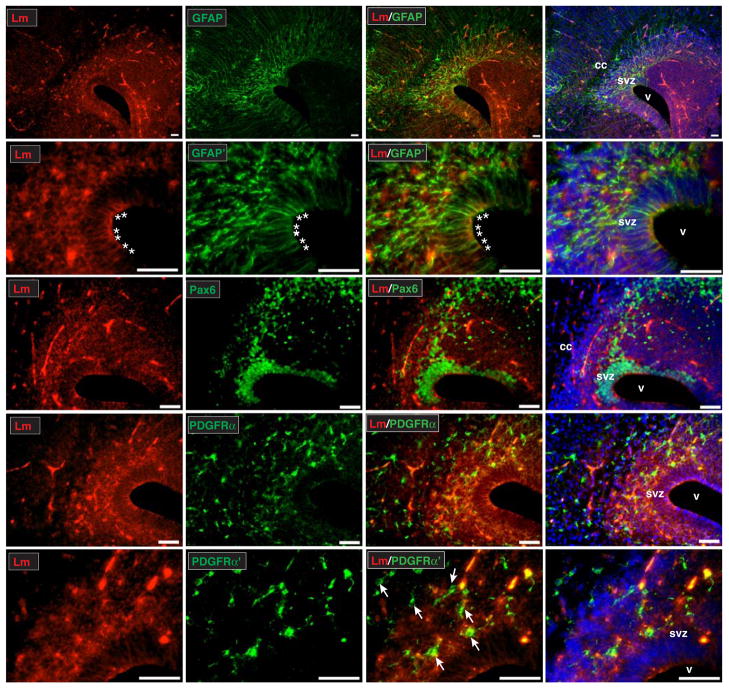
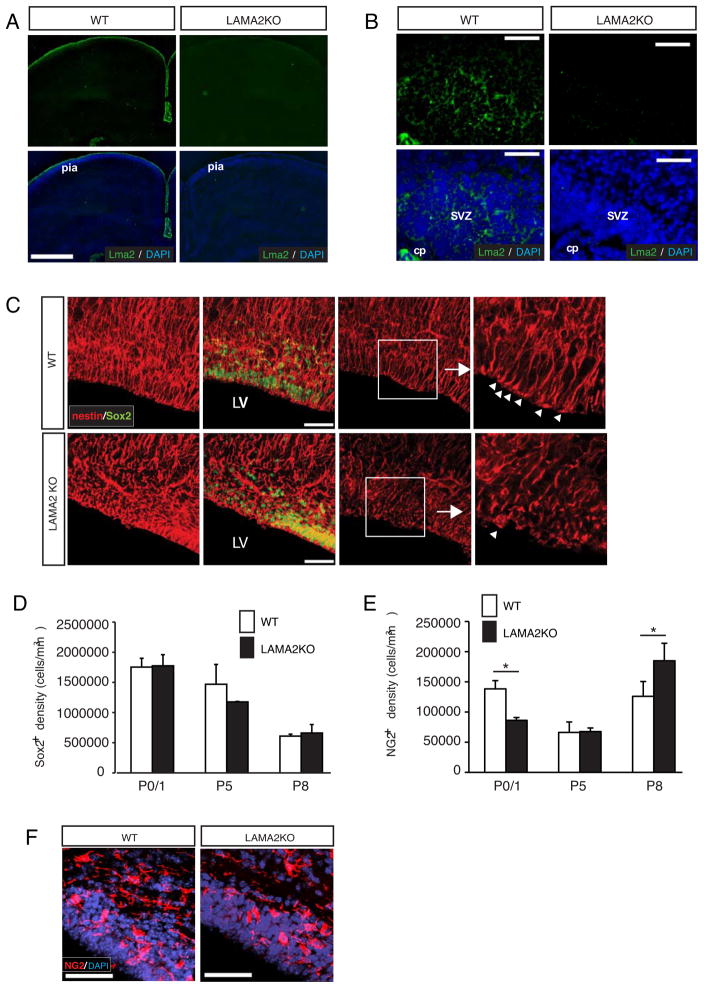
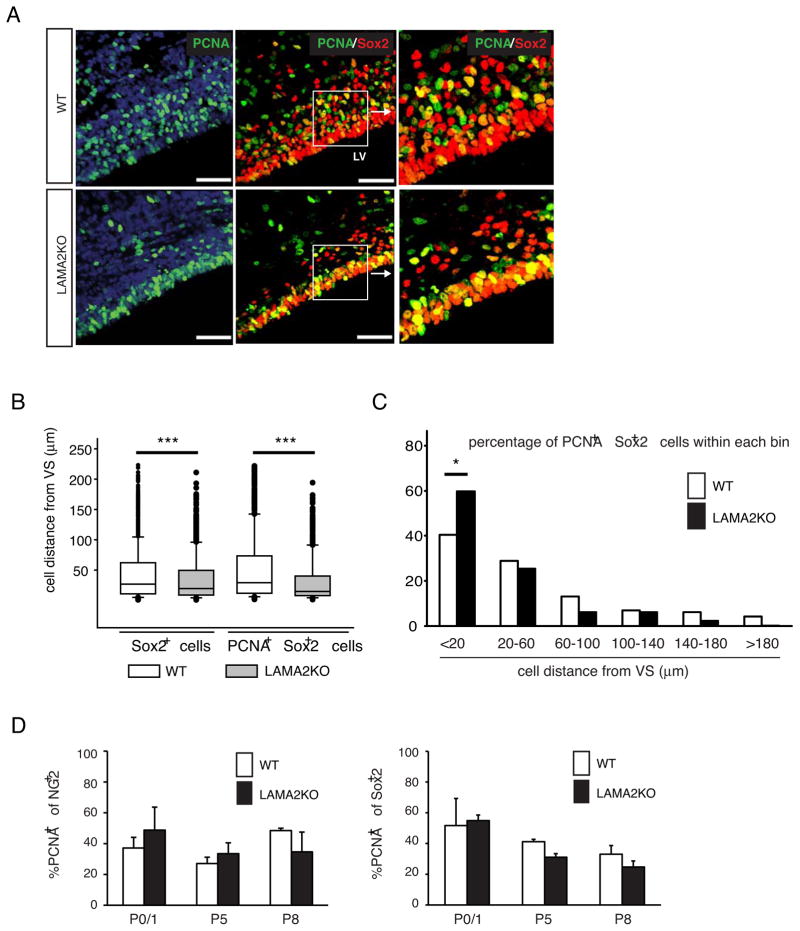
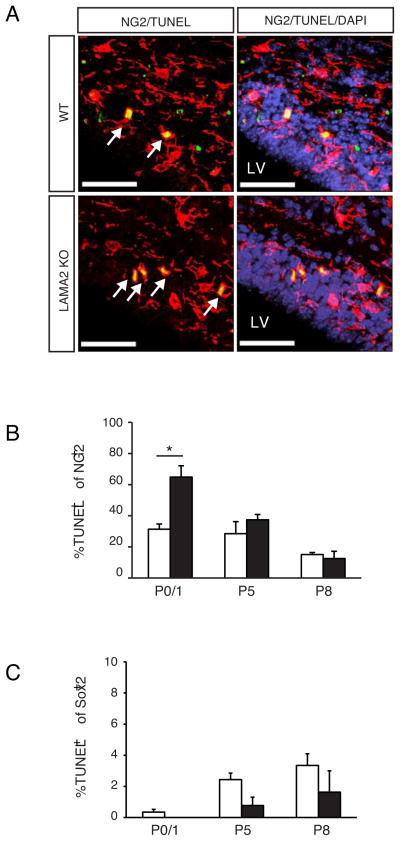
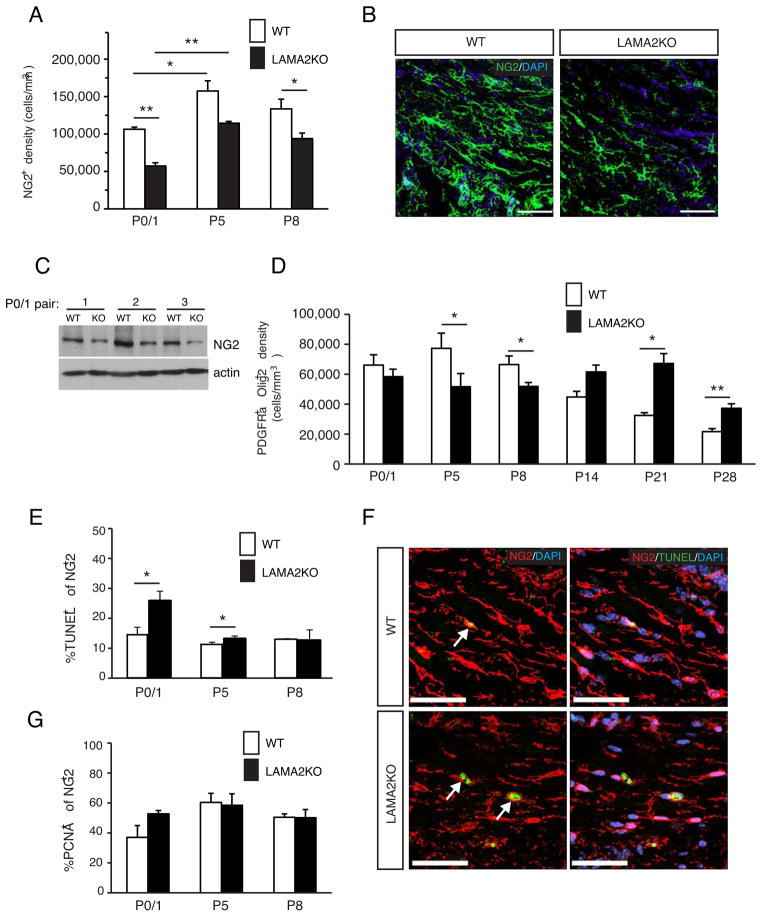
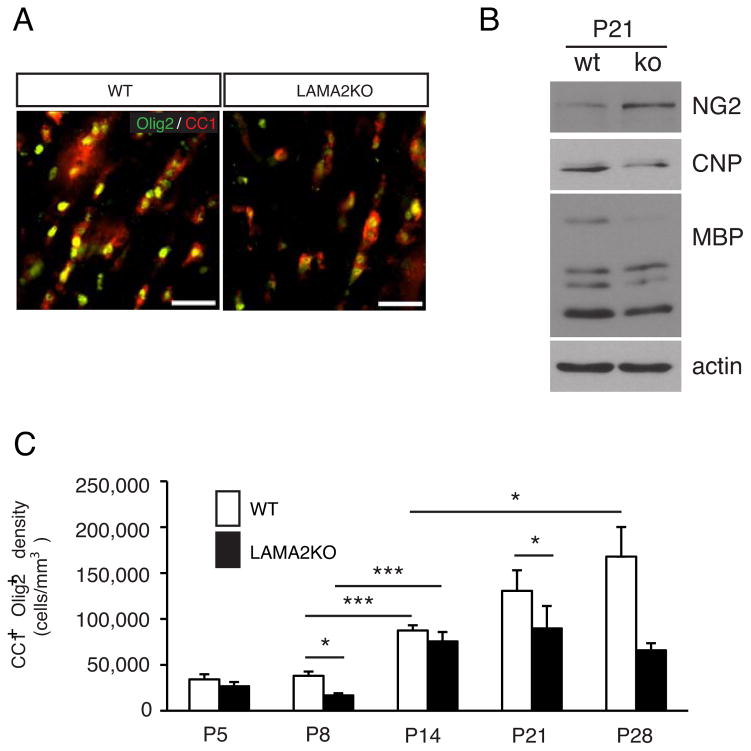
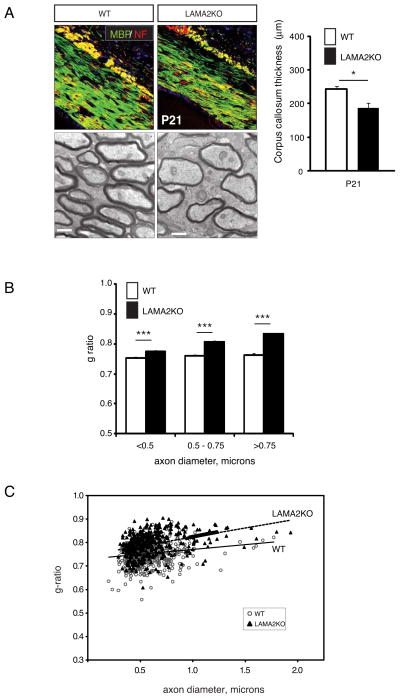
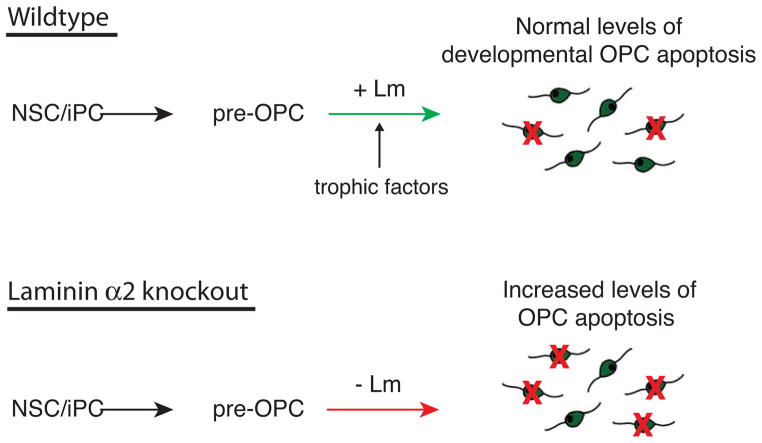
The laminin family of extracellular matrix proteins are expressed broadly during embryonic brain development, but are enriched at ventricular and pial surfaces where laminins mediate radial glial attachment during corticogenesis. In the adult brain, however, laminin distribution is restricted, yet is found within the vascular basal lamina and associated fractones of the ventricular zone (VZ)-subventricular zone (SVZ) stem cell niche, where laminins regulate adult neural progenitor cell proliferation. It remains unknown, however, if laminins regulate the wave of oligodendrogenesis that occurs in the neonatal/early postnatal VZ-SVZ. Here we report that Lama2, the gene that encodes the laminin α2-subunit, regulates postnatal oligodendrogenesis. At birth, Lama2-/- mice had significantly higher levels of dying oligodendrocyte progenitor cells (OPCs) in the OPC germinal zone of the dorsal SVZ. This translated into fewer OPCs, both in the dorsal SVZ well as in an adjacent developing white matter tract, the corpus callosum. In addition, intermediate progenitor cells that give rise to OPCs in the Lama2-/- VZ-SVZ were mislocalized and proliferated nearer to the ventricle surface. Later, delays in oligodendrocyte maturation (with accompanying OPC accumulation), were observed in the Lama2-/- corpus callosum, leading to dysmyelination by postnatal day 21. Together these data suggest that prosurvival laminin interactions in the developing postnatal VZ-SVZ germinal zone regulate the ability, or timing, of oligodendrocyte production to occur appropriately.


Figures

Figure 1
Figure 1. Stem and progenitor cells of the SVZ are found in contact with laminin at the onset of postnatal gliogenesis
Immunohistochemistry with a laminin γ1 subunit (Lm, red) antibody on 25μm coronal sections of cerebral cortices reveals high levels of laminin expression in the SVZ and adjacent regions at postnatal day 1. Laminin immunohistochemistry was performed in conjunction with the following cell lineage specific antibodies: GFAP (green, to visualize radial glia and stem/progenitors of the SVZ), Pax6 (green, to visualize stem/progenitor nuclei in the SVZ and adjacent regions), and PDGFRα (green, to visualize OPCs). In the case of higher magnification images (Lm/GFAP′ and Lm/PDGFRα′), images shown are maximal projections of z-stacks of either 10.7 μm (Lm/GFAP′) or 12.4 μm (Lm/PDGFRα′). Pericellular laminin immunoreactivity was observed in the SVZ and adjacent regions, as well as in blood vessel basal lamina. Prominent laminin immunoreactivity was additionally seen in conjunction with apical radial glial endfeet (Lm/GFAP′ panel, endfeet indicated with asterisks), as well as along radial glial processes themselves. Examples of PDGFRα+ cells in the SVZ (often in contact with laminin) are indicated (Lm/PDGFRα′ panel, arrows). Nuclei are visualized using DAPI (blue). Scale bar in all images is equal to 50 microns. cc, corpus callosum; svz, subventricular zone; v, lateral ventricle.
Figure 2
Figure 2. Abnormal progenitor cell organization and density in the postnatal SVZ of laminin α2-knockout mice
(A) Laminin α2 (Lma2) immunoreactivity (green) was observed in the pial basal lamina surrounding wildtype (WT) cortices, but was absent in laminin α2-knockout (LAMA2KO) cortices. Scale bar=500 microns. (B) Laminin α2 protein (Lma2; green) was detected in the subventricular zone (SVZ) and choroid plexus (cp) of wildtype mice (WT) at P1, but not in laminin mutant (LAMA2KO) SVZ. Scale bar=50 microns. (C) Using immunohistochemistry on floating 40 micron sections, radial glial cells (nestin+, red) and neural stem/intermediate progenitor cell nuclei (Sox2+, green) were visualized using projected images in the SVZ of LAMA2KO mice or wildtype (WT) littermates at P0. Radial glial cells appeared disorganized at the apical surface of the lateral ventricle (LV) in LAMA2KO mice (inset, right). Scale bar=50 microns. Right panels: nestin (red) and Sox2 (green) immunocytochemistry in representative single plane images of wildtype (WT) and mutant (LAMA2KO) SVZ obtained at higher magnification. Scale bar=20 microns. Small arrows indicate radial glial endfeet at their sites of apical attachment. (D) Sox2+ progenitor cells per mm3 in the SVZ in wildtype (white bars, WT) and mutant (black bars, LAMA2KO) littermates at ages postnatal day 0/1 (P0/1), P5, and P8. Graphs are mean (±sem) counts obtained from 3 different areas of the dorsal SVZ (n=3). (E) Oligodendrocyte progenitor cells (NG2+) per mm3 in the dorsal SVZ in wildtype (white bars, WT) and laminin α2-knockout (black bars, LAMA2KO) littermates at ages P0/1, P5, and P8. Graphs are mean (±sem) counts obtained from 3 different areas of the dorsal SVZ (n=4; *p<0.05). (F) Representative images of NG2 (red) immunocytochemistry in the postnatal SVZ of wildtype (WT) and mutant (LAMA2KO) mice. Compared to wildtype (WT), LAMA2KO mice have fewer NG2+ cells in the SVZ at P1. Scale bar=50 microns. Nuclei are visualized using DAPI (blue).
Figure 3
Figure 3. Altered positioning of proliferative Sox2+ progenitor cells in the laminin α2 knockout SVZ
(A) Leftmost panels: representative images of PCNA (green) immunocytochemistry in wildtype (WT) and mutant (LAMA2KO) SVZ. Middle panels: representative images of Sox2 (red) and PCNA (green) immunocytochemistry in wildtype (WT) and mutant (LAMA2KO) SVZ. Scale bars=50 microns. Proliferating Sox2+ cells were found abnormally close to the lateral ventricle (LV) in the LAMA2KO SVZ (inset, right), compared to that seen in the WT SVZ (inset, right). Nuclei were visualized using DAPI (blue). (B) Box plots of the distances of Sox2+ and proliferating i.e. PCNA+, Sox2+ cells from the ventricle surface (VS) in wildtype (white boxes; WT) and mutant (gray boxes; LAMA2KO) dorsal SVZ at P1. Each horizontal line represents the 10th, 25th, 50th (median), 75th and 90th percentiles. Based on median distance values (center bar), Sox2+ and PCNA+Sox2+ cells can be found significantly closer to the VS in the LAMA2KO SVZ compared to WT (n=1065–1378 total Sox2+ cells; n=564–788 PCNA+ cells within the Sox2+ population; ***p<0.001). (C) Individual PCNA+Sox2+ cell distance measurements were grouped to reveal that an increased percentage of proliferating Sox2+ cells were positioned closer (i.e., <20 microns away) to the ventricular surface (VS) in the SVZ of laminin α2-knockout mice (black bars; LAMA2KO), compared to the wildtype (white bars; WT) SVZ (*p<0.05). (D) Left panel: Percentages of PCNA-positive cells within the NG2+ cell population of the SVZ were not significantly different between wildtype (white bars; WT) and laminin α2-knockout (black bars; LAMA2KO) mice at postnatal day 0/1 (P0/1), P5, and P8 (n=3). Right panel: The percentages of PCNA-positive cells within the Sox2+ cell population were also determined in wildtype (white bars; WT) and laminin α2-knockout (LAMA2KO) SVZ at P0/1, P5, and P8 (n=3). No significant differences were observed between WT and LAMA2KO animals at these timepoints. Graphed values depict mean (±sem) percentages obtained from 3 different regions of the dorsal SVZ.
Figure 4
Figure 4. Elevated levels of oligodendrocyte progenitor death in the LAMA2KO subventricular zone
(A) NG2 immunocytochemistry (red) to visualize oligodendrocyte progenitor cells was performed in combination with TUNEL to detect dying cells (green). Representative fields are shown from P1 wildtype (WT) and laminin α2-knockout (LAMA2KO) SVZ dorsal to the lateral ventricle (LV). Arrows depict TUNEL+NG2+ cells. Scale bars=50 microns. (B) Percentages of TUNEL+ cells in the NG2+ populations in the dorsal SVZ were determined in wildtype (white bars, WT) and laminin α2-knockout (black bars, LAMA2KO) littermates at ages P0/1, P5, and P8. A significant increase in OPC death was observed in the SVZ of mutant mice compared to wildtype. Graphs are mean (±sem) counts obtained from 3 different areas of the dorsal SVZ (n=3; *p<0.05). (C) No significant differences in Sox2+ cell-specific apoptosis were observed between wildtype and laminin α2 knockout mice. Percentages of TUNEL-positive cells in the Sox2+ populations in the SVZ were determined in wildtype (white bars, WT) and laminin α2-knockout (black bars, LAMA2KO) littermates at ages P0/1, P5, and P8. Graphs are mean (±sem) counts obtained from 3 fields in the dorsal SVZ (n=3).
Figure 5
Figure 5. Oligodendrocyte progenitor cell densities are abnormal in the developing white matter of LAMA2KO mice
(A) Mean density of NG2-positive oligodendrocyte progenitor cells (OPCs) per white matter volume (mm3) is shown for wildtype (white bars; WT) and laminin α2-knockout (black bars; LAMA2KO) corpus callosum at P0/1, P5, and P8. Loss of laminin α2 leads to significant decreases in the density of NG2+ OPCs in the corpus callosum during early postnatal development. Graphs are mean (±sem) counts obtained from 4 different areas of the corpus callosum (*p<0.05, **p<0.01, n=3–4). (B) Representative fields from P1 wildtype (WT) and laminin α2-knockout (LAMA2KO) corpus callosum are shown. NG2 immunocytochemistry (green) was performed to visualize OPCs. Nuclei were stained with DAPI (blue). Scale bars denote 50 microns. (C) Cerebral cortical lysates were evaluated by Western blot to detect protein levels of NG2 or actin (loading control). Representative blots from P0/1 wildtype (WT) and laminin α2-knockout (KO) littermates show decreased NG2 protein levels in KO cortical lysates relative to those from WT littermates (n=3). (D) Mean densities of cells that were double positive for PDGFRα (a marker expressed in OPCs, but not in differentiated oligodendrocytes) and Olig2 (a transcription factor expressed in oligodendrocyte lineage cells) per volume (mm3) of the WT (white bars) and LAMA2KO (black bars) corpus callosum were evaluated at 6 developmental timepoints (i.e., P0/1, P5, P8, P14, P21, and P28). Prior to P14, LAMA2KO mice had significantly less PDGFRα+Olig2+ cells in the corpus callosum than their WT littermates. After the 2-week timepoint, however, the numbers of PDGFRα+Olig2+ OPCs were significantly higher in the LAMA2KO corpus callosum than in WT. Graphed values are mean (±sem) cell densities measured from 4 different areas of the corpus callosum (*p<0.05, **p<0.01, n=3). (E) Graph depicts mean percentages of TUNEL-positive cells out of the NG2+ OPC population in the wildtype (white bars; WT) and laminin α2-knockout (black bars; LAMA2KO) corpus callosum, at 3 different postnatal timepoints (n=3–5). Increased OPC apoptosis (i.e., %TUNEL+ of NG2+ cells) was observed in the LAMA2KO corpus callosum at early postnatal timepoints (i.e., P1 and P5; *p<0.05). (F) Representative images taken from P1 wildtype (WT) and laminin α2-knockout (LAMA2KO) corpus callosum are shown. NG2 immunocytochemistry (Kerever et al.) was performed in combination with TUNEL (green) to detect apoptotic OPCs in the developing white matter tracts of WT and LAMA2KO mice at P1. Arrows depict TUNEL-positive NG2+ cells. Nuclei were counterstained with DAPI (blue). Scale bars denote 50 microns. (G) The percentages of proliferating OPCs were determined in the wildtype (white bars; WT) and laminin α2-knockout (black bars; LAMA2KO) at P0/1, P5, and P8 by immunohistochemistry with antibodies against PCNA (a marker of proliferating cells) and NG2. In the corpus callosum, no significant differences were observed in the mean percentages of PCNA-positive cells in the NG2+ OPCs of WT and LAMA2KO mice (n=3).
Figure 6
Figure 6. Defective oligodendrocyte maturation in laminin α2-knockout brains
(A) Immunocytochemistry using anti-CC1 (a marker of mature oligodendrocytes, red) and anti-Olig2 (a pan-oligodendrocyte lineage cell marker, green) antibodies was performed to visualize mature oligodendrocyte cells. Representative fields are shown from P21 wildtype (WT) and laminin α2-knockout (LAMA2KO) corpus callosum. Scale bar=50 microns. (B) Representative western blots of cerebral cortical lysates from P21 wildtype (WT) and laminin α2-knockout (LAMA2KO) littermates show differential expression of oligodendrocyte stage specific protein markers. Compared to wildtype mice, LAMA2KO animals had elevated levels of the NG2 protein (expressed in oligodendrocyte progenitors) and decreased levels of the oligodendrocyte maturation markers CNP and MBP. Actin was used as a loading control. (C) The mean cell densities co-expressing CC1 and Olig2 per volume (mm3) of corpus callosum were determined for wildtype (white bars, WT) and laminin α2-knockout (black bars, LAMA2KO) animals at 5 postnatal timepoints (i.e., P5, P8, P14, P21, and P28). LAMA2KO mice had significantly fewer CC1+Olig2+ mature oligodendrocytes in the white matter compared to their WT littermates at various timepoints analyzed. (n=3–4, *p<0.05, ***p<0.005). Graphs depict mean (±sem) cell densities measured from 4 different areas of the corpus callosum.
Figure 7
Figure 7. Abnormal myelin in the laminin α2-knockout corpus callosum
(A) Top panels: immunocytochemistry to visualize MBP (green) and neurofilament (Blaess et al.; Kerever et al.) in wildype (WT) and laminin α2-knockout (LAMA2KO) 3 week-old corpus callosum. Sections are counterstained with DAPI (blue) to visualize nuclei. Scale bars=50 microns. Bottom panels: Representative electron micrographs of the corpus callosum revealed thinner myelin in the axons of the LAMA2KO corpus callosum relative to WT at P21. Scale bars=500nm. (B) The mean thickness of the corpus callosum was measured in wildtype (white bars, WT) and laminin α2-knockout (black bars, LAMA2KO) animals at P21. LAMA2KO mice had significantly thinner corpora callosa compared to their WT littermates at P21 (n=4, *p<0.05). Graph depicts mean (±sem) callosal thickness values. (C) Axon g-ratios were binned by axon diameter to reveal that axons of all sizes in LAMA2KO corpus callosum (black bars) had thinner myelin (i.e., higher median g-ratios) compared to wildtype (white bars) (***p<0.001). (D) Corpora callosa g-ratios were plotted as a function of axon diameter for wildtype (open circles; WT) and laminin α2-knockout (black triangles; LAMA2KO) P21 mice. Overall median g-ratios were significantly different (p<0.001) between WT and LAMA2KO axons in the corpus callosum (0.822; n=567 axons evaluated in 3 laminin α2-knockout animals compared to 0.755; n=387 axons analysed in 2 wildtype littermates). No change was observed in the corpus callosum as to the degree of unmyelinated axons.
Figure 8
Figure 8. Laminin in the SVZ helps to ensure appropriate numbers of OPCs
Many newly-born oligodendrocyte progenitor cells (OPCs) die due to developmental programmed cell death in the perinatal SVZ. However, OPC death is significantly elevated in the subventricular zone (SVZ) and adjacent white matter tract of early postnatal laminin-knockout brains. Laminin thus promotes the survival of OPCs in the gliogenic niche, allowing the appropriate numbers of OPCs to populate their target white matter tracts. This survival-promoting effect is likely indirect e.g. by localizing or enhancing trophic factor signals, as isolated OPCs do not survive better on laminin substrates.

Similar articles

Cited by

References

    1. Allamand V, Guicheney P. Merosin-deficient congenital muscular dystrophy, autosomal recessive (MDC1A, MIM# 156225, LAMA2 gene coding for α2 chain of laminin) European Journal of Human Genetics. 2002;10:91–94. - PubMed
    1. Benninger Y, Colognato H, Thurnherr T, Franklin RJM, Leone DP, Atanasoski S, Nave K-A, ffrench-Constant C, Suter U, Relvas JB. β1-integrin signaling mediates premyelinating oligodendrocyte survival but is not required for CNS myelination and remyelination. The Journal of Neuroscience. 2006;26:7665–7673. - PMC - PubMed
    1. Blaess S, Graus-Porta D, Belvindrah R, Radakovits R, Pons S, Littlewood-Evans A, Senften M, Guo H, Li Y, Miner JH, Reichardt LF, Müller U. β1-Integrins are critical for cerebellar granule cell precursor proliferation. The Journal of Neuroscience. 2004;24:3402–3412. - PMC - PubMed
    1. Bongarzone ER. Induction of oligodendrocyte fate during the formation of the vertebrate neural tube. Neurochemical Research. 2002;27:1361–1369. - PubMed
    1. Buteică E, Roşulescu E, Burada F, Stănoiu B, Zăvăleanu M. Merosin-deficient congenital muscular dystrophy type 1A. Romanian Journal of Morphology and Embryology. 2008;49:229–233. - PubMed

Publication types

MeSH terms