. 2012 Sep 1;95(4):430-8.
doi: 10.1093/cvr/cvs195. Epub 2012 Jun 15.

Ultrastructural remodelling of Ca(2+) signalling apparatus in failing heart cells

Affiliations

Ultrastructural remodelling of Ca(2+) signalling apparatus in failing heart cells

Hao-Di Wu et al. Cardiovasc Res. .

Abstract

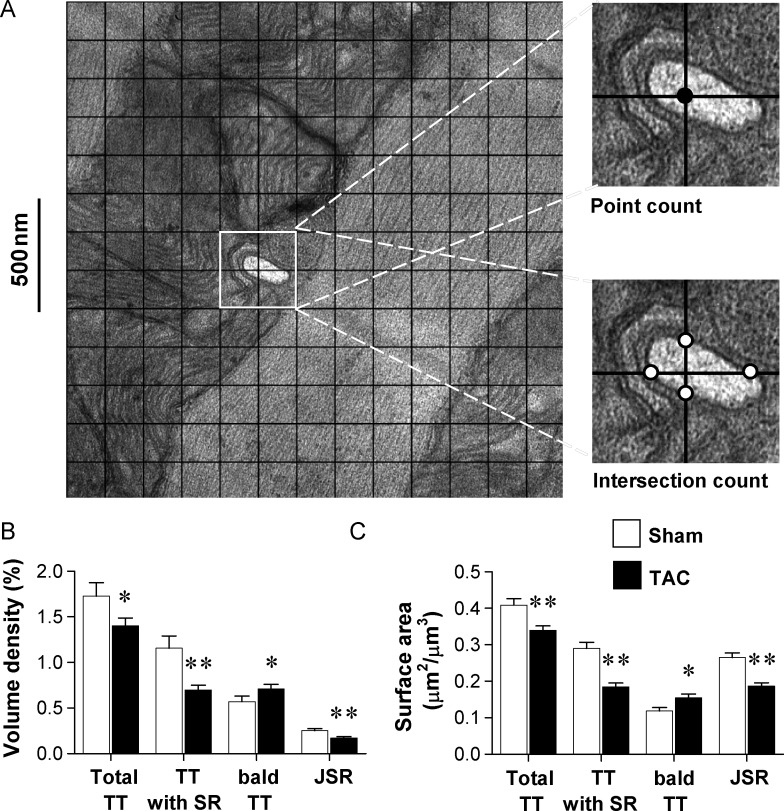
Aims: The contraction of a heart cell is controlled by Ca(2+)-induced Ca(2+) release between L-type Ca(2+) channels (LCCs) in the cell membrane/T-tubules (TTs) and ryanodine receptors (RyRs) in the junctional sarcoplasmic reticulum (SR). During heart failure, LCC-RyR signalling becomes defective. The purpose of the present study was to reveal the ultrastructural mechanism underlying the defective LCC-RyR signalling and contractility.

Methods and results: In rat models of heart failure produced by transverse aortic constriction surgery, stereological analysis of transmission electron microscopic images showed that the volume density and the surface area of junctional SRs and those of SR-coupled TTs were both decreased in failing heart cells. The TT-SR junctions were displaced or missing from the Z-line areas. Moreover, the spatial span of individual TT-SR junctions was markedly reduced in failing heart cells. Numerical simulation and junctophilin-2 knockdown experiments demonstrated that the decrease in junction size (and thereby the constitutive LCC and RyR numbers) led to a scattered delay of Ca(2+) release activation.

Conclusions: The shrinking and eventual absence of TT-SR junctions are important mechanisms underlying the desynchronized and inhomogeneous Ca(2+) release and the decreased contractile strength in heart failure. Maintaining the nanoscopic integrity of TT-SR junctions thus represents a therapeutic strategy against heart failure and related cardiomyopathies.


Figures

Figure 1
Figure 1
Stereological measurements of TTs and junctional SRs in rat heart failure model. (A) Representative TEM images from a TAC rat, illustrating the stereological measurements of cardiomyocytes. The grid lines were spaced 0.167 μm apart. The closed circle and open circles denote examples of point counts and intersection counts, respectively. (B) The volume density of total TTs, TTs with SRs, bald TTs, and junctional SRs (JSR) were compared between sham (white, 160 images from 6 rats) and TAC (black, 200 images from 10 rats) groups. (C) The surface area of total TTs, TTs with SRs, bald TTs, and JSRs were compared between sham and TAC groups. More than 3000 μm2 of image area were analysed in each group. *P< 0.05 and **P< 0.01 vs. shamgroup.
Figure 2
Figure 2
Regularity of junction appearance in failing heart cells. (A) Representative TEM images of cardiomyocytes from sham-operated (left) and TAC (right) rats. White arrows indicate TTs coupled with SRs. (B) Junction presence rate measured as the percentage of non-myofilament areas between adjacent M-lines that displayed junctions. For data analysis, 160 and 200 TEM images were taken from 6 sham and 10 TAC rats, and more than 3000 μm2 of image area were analysed in each group. (C) Distribution and Gaussian fittings of inter-junction distance in sham (white bars and red curve) and TAC (black bars and blue curve) groups. The inter-junction distance was measured from more than 520 junction pairs in each group. Data were from 160 and 200 TEM images of 6 sham and 10 TAC rats, respectively. **P< 0.01 vs. sham group.
Figure 3
Figure 3
Positioning of TT–SR junctions in failing heart cells. (A) Representative TEM images from the TAC group showing the measurement of distance (red) between the centre of a junction cleft (yellow) and an adjacent Z-line (blue). (B) Distance between junctions and Z-lines (junction-Z distance) compared between sham (white) and TAC (black) groups, Data were measured from more than 780 junctions in each group. Data were from 160 and 200 TEM images of sham (n= 6) and TAC (n= 10) rats, respectively. **P< 0.01 vs. sham group. (C) Distribution of junction-Z distance in sham and TAC groups.
Figure 4
Figure 4
Measurement of individual junction size in failing heart cells. (A) Representative TEM images from the sham group illustrating the selection of a region-of-interest. The junction region (left, red box) was selected and analysed (right). The TT–SR junctional cleft was marked in yellow. The junction length was measured as the curvilinear length of the yellow line. (B) Distributions and logarithmic normal fittings of the length of junction cleft in sham (white bars and red curve) and TAC (black bars and blue curve) groups. (C) Average length of junctions. Data from more than 100 junctions from sham (n= 6) and TAC (n= 10) rats, respectively. **P< 0.01 vs. sham group.
Figure 5
Figure 5
Relationship between junction size and Ca2+ release performance. (A) Schematic diagrams of two junctions composed of 20 LCCs (blue dots) + 100 RyRs (orange squares) and 13 LCCs + 64 RyRs. (B) Simulated distribution of the time delay from depolarization to RyR activation (Dfire) in junctions composed of different numbers of LCCs and RyRs. (C) Simulated Ca2+ transients generated by a model system composed of junctions with different numbers of LCCs and RyRs.
Figure 6
Figure 6
Effect of JP2 knockdown on the structure and function of TT–SR junctions. (A) Presence rate (upper) and length (lower) of junctions in the inter-M area in control and JP2 shRNA groups. Data for the upper panel were collected from 134 and 171 TEM images from three individual experiments in either the control or JP2 shRNA group, and more than 2500 μm2 of image area were analysed in each group, and more than 300 individual junction TEM images were analysed in each group for the lower panel. (B) Typical images (upper) and time courses (lower) of Ca2+ spikes evoked by depolarization from −70 to 0 mV in control (left) and JP2 shRNA (right) groups. The black/white strip beside each colour image is a positioning reference of Z-lines derived from the contrast-enhanced fluo-4 fluorescence prior to depolarization, as described by Song et al. The letters a–f denote the sampling positions of the time courses of Ca2+ spikes. (C) The I–V curve of Ica in control and JP2 shRNA group. (D) The spike amplitude of the two groups. (E) Chance of failure of Ca2+ spikes measured as the percentage of sarcomeres without Ca2+ spikes at their Z-line areas. (F) Delay of Ca2+ spikes (Dspike) measured as the time from depolarization to the peak of Ca2+ spikes as illustrated in (B). The red and blue lines represent the three-parameter-log normal fittings of the Dspike distribution in control and JP2 RNA groups, respectively. The normalized fit curves are compared in the right insert. (G) The standard deviations of Dspike are compared between the two groups. Data from ≥15 cells in ≥4 animals in each group. *P< 0.05 and **P< 0.01 vs. control group.

Comment in

References

    1. Berridge MJ, Bootman MD, Roderick HL. Calcium signalling: dynamics, homeostasis and remodelling. Nat Rev Mol Cell Biol. 2003;4:517–529. - PubMed
    1. Fabiato A. Time and calcium dependence of activation and inactivation of calcium-induced release of calcium from the sarcoplasmic reticulum of a skinned canine cardiac Purkinje cell. J Gen Physiol. 1985;85:247–289. - PMC - PubMed
    1. Lopez-Lopez JR, Shacklock PS, Balke CW, Wier WG. Local calcium transients triggered by single L-type calcium channel currents in cardiac cells. Science. 1995;268:1042–1045. - PubMed
    1. Rios E, Stern MD. Calcium in close quarters: microdomain feedback in excitation-contraction coupling and other cell biological phenomena. Annu Rev Biophys Biomol Struct. 1997;26:47–82. - PubMed
    1. Cheng H, Lederer WJ, Cannell MB. Calcium sparks: elementary events underlying excitation-contraction coupling in heart muscle. Science. 1993;262:740–744. - PubMed

Publication types

MeSH terms

Substances