. 2012 Nov;56(5):1792-803.
doi: 10.1002/hep.25890. Epub 2012 Aug 22.

Transcriptomic profiling reveals hepatic stem-like gene signatures and interplay of miR-200c and epithelial-mesenchymal transition in intrahepatic cholangiocarcinoma

Affiliations

Transcriptomic profiling reveals hepatic stem-like gene signatures and interplay of miR-200c and epithelial-mesenchymal transition in intrahepatic cholangiocarcinoma

Naoki Oishi et al. Hepatology. 2012 Nov.

Abstract

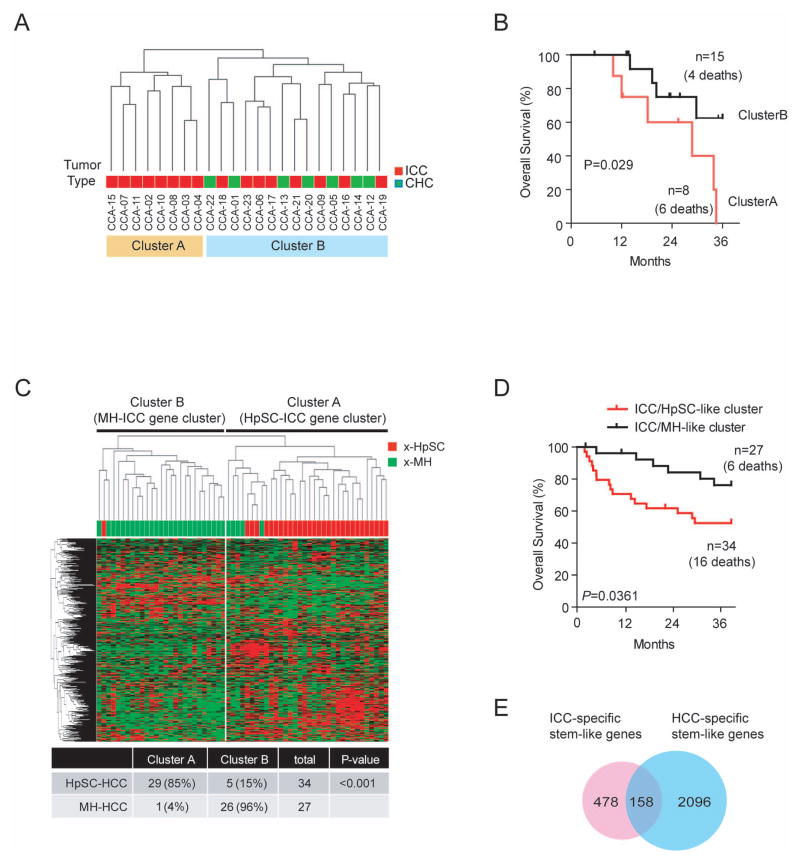
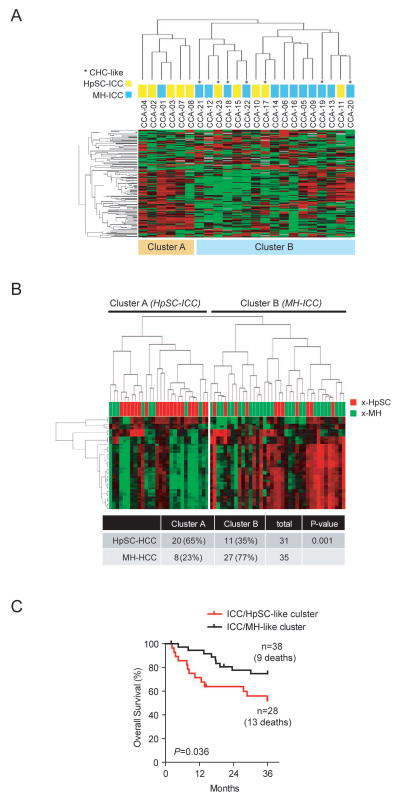
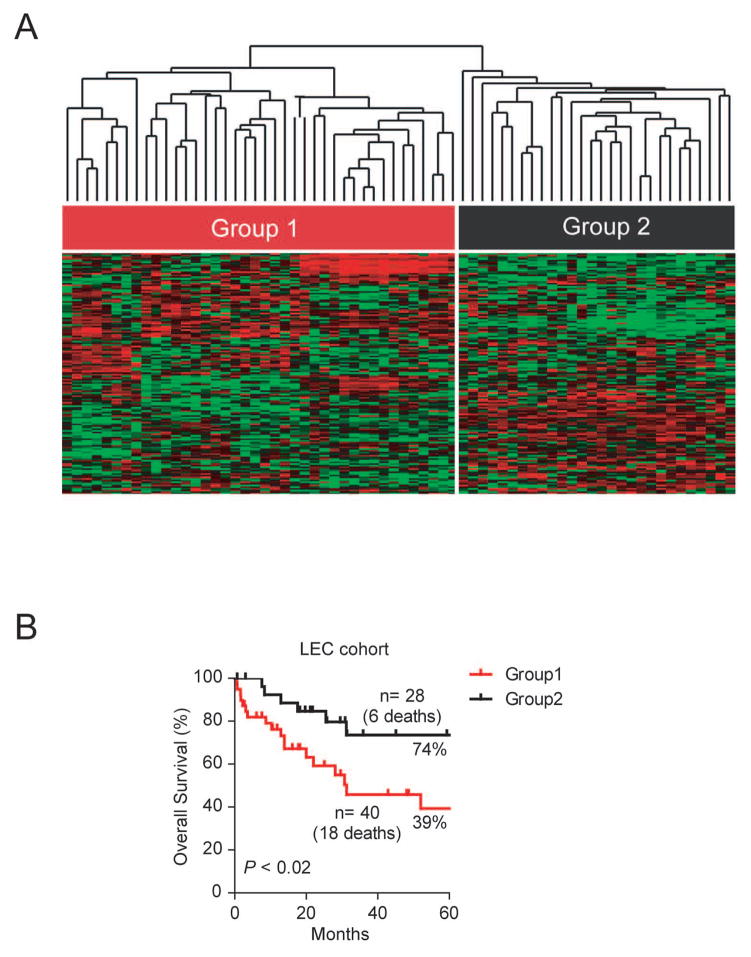
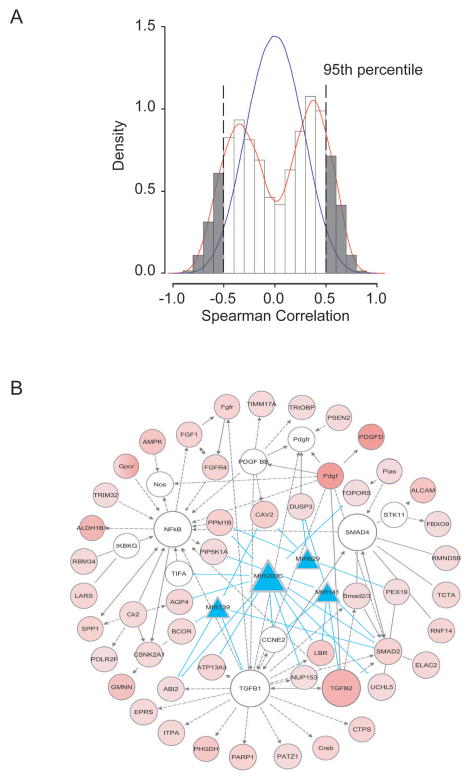
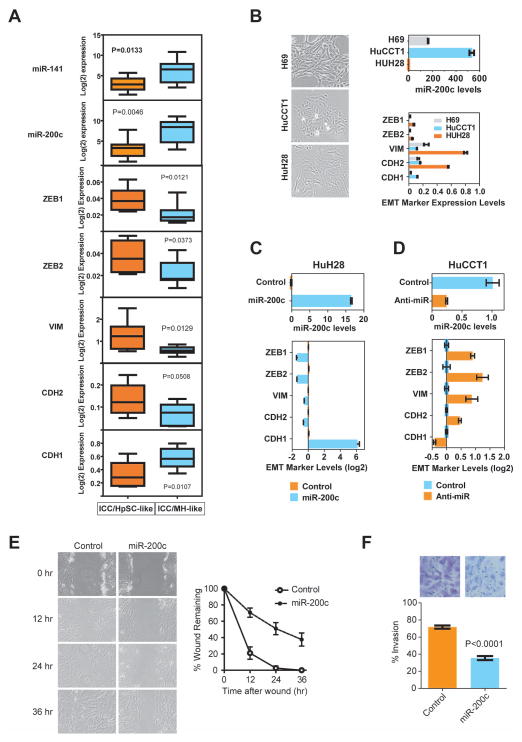
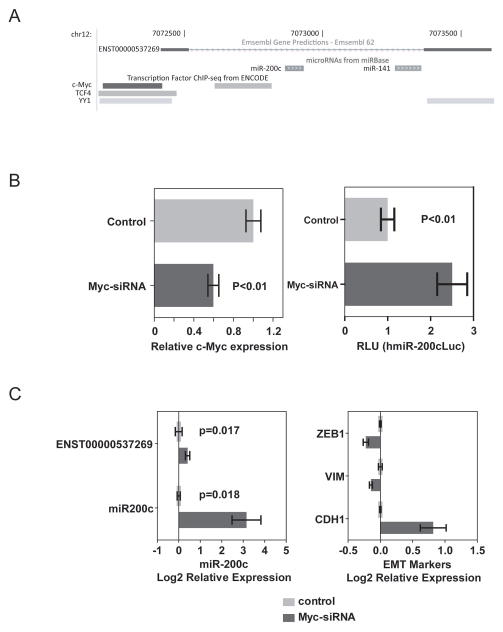
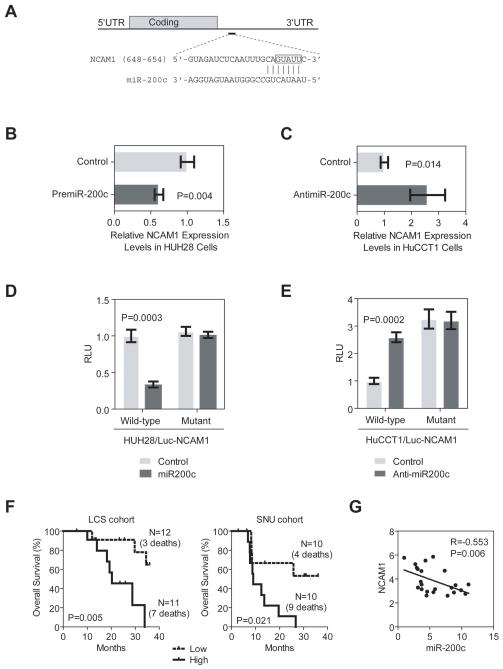
Intrahepatic cholangiocellular carcinoma (ICC) is the second most common type of primary liver cancer. However, its tumor heterogeneity and molecular characteristics are largely unknown. In this study, we conducted transcriptomic profiling of 23 ICC and combined hepatocellular cholangiocarcinoma tumor specimens from Asian patients using Affymetrix messenger RNA (mRNA) and NanoString microRNA microarrays to search for unique gene signatures linked to tumor subtypes and patient prognosis. We validated the signatures in an additional 68 ICC cases derived from Caucasian patients. We found that both mRNA and microRNA expression profiles could independently classify Asian ICC cases into two main subgroups, one of which shared gene expression signatures with previously identified hepatocellular carcinoma (HCC) with stem cell gene expression traits. ICC-specific gene signatures could predict survival in Asian HCC cases and independently in Caucasian ICC cases. Integrative analyses of the ICC-specific mRNA and microRNA expression profiles revealed that a common signaling pathway linking miR-200c signaling to epithelial-mesenchymal transition (EMT) was preferentially activated in ICC with stem cell gene expression traits. Inactivation of miR-200c resulted in an induction of EMT, whereas activation of miR-200c led to a reduction of EMT including a reduced cell migration and invasion in ICC cells. We also found that miR-200c and neural cell adhesion molecule 1 (NCAM1) expression were negatively correlated and their expression levels were predictive of survival in ICC samples. NCAM1, a known hepatic stem/progenitor cell marker, was experimentally demonstrated to be a direct target of miR-200c.

Conclusion: Our results indicate that ICC and HCC share common stem-like molecular characteristics and poor prognosis. We suggest that the specific components of EMT may be exploited as critical biomarkers and clinically relevant therapeutic targets for an aggressive form of stem cell-like ICC.


Conflict of interest statement

Potential conflict of interest: Nothing to report

Figures

Figure 1
Figure 1
Heterogeneity of Asian ICC and HCC cases based on mRNA expression profiling. (A) Unsupervised hierarchical clustering of 23 ICC and CHC cases based on global mRNA expression using centered correlation and average linkage. The red and orange bars beneath the dendrogram indicate ICC and ICC with CHC features, respectively. ICC cases in cluster-A are referred as HpSC-ICC and ICC cases in Cluster-B are referred as MH-ICC. (B) Kaplan-Meier analysis of ICC cases based on the classification of cluster-A and cluster-B from panel A. (C) Hierarchical clustering of 61 extreme HCC cases (i.e., 34 x-HpSC HCC and 27 x-MH HCC) based on the expression of 636 ICC-specific genes. The red and green bars above heatmap indicate x-HpSC and x-MH, respectively. A summary of HCC cases based on the dendrogram classification with the ICC-specific signature is included. Chi-squared test was used to determine the correct classification. (D) Kaplan-Meir plot of 61 extreme HCC cases based on the classification by the 636-gene signature into HpSC-ICC and MH-ICC clusters. (E) Venn-diagram of stem-like ICC genes and stem-like HCC genes.
Figure 2
Figure 2
Heterogeneity of Asian ICC cases revealed by microRNA expression profiling. (A) Unsupervised hierarchical clustering of 23 Asian ICC cases based on global microRNA expression using centered correlation and average linkage. The yellow and light blue bars beneath the dendrogram indicate HpSC-ICC and MH-ICC subgroups, respectively, as classified by mRNA expression profiling described in Fig 1A. *, CHC-like cases. (B) Hierarchical clustering of 61 extreme HCC cases based on the expression of 23 ICC-specific microRNAs. The red and green bars above heatmap indicate x-HpSC and x-MH, respectively. A summary of HCC cases based on the dendrogram classification with the ICC-specific signature is included. Chi-squared test was used to determine the correct classification. (C) Kaplan Meir plot of 61 extreme HCC cases based on the clustering results of panel B.
Figure 3
Figure 3
Validation of the ICC-specific gene signature in an independent ICC cohort as a survival predictor. (A) Hierarchical clustering of 68 Caucasian ICC cases based on the expression of 158 overlapping genes between stem-like ICC and stem-like HCC genes using centered correlation and average linkage. The heatmap depicts high (red) and low (green expression of these genes based on a log2 scale. (B) Kaplan-Meier plot of 68 ICC patients based on the dendrogram classification from panel A.
Figure 4
Figure 4
Integrative analyses of ICC-specific mRNA and microRNAs based on spearman correlation and Ingenuity Pathway. (A) Correlation between ICC-specific 636 mRNA and 23 microRNA signatures. (B) The top nine gene networks of signaling including TGF-β, Smad4 and NF-κB pathways activated in stem-like ICC tumors. Red shaded ovals represent up-regulated genes in HpSC-ICC tumors, and open ovals represent genes that are not on the list of significant genes but are reported to be associated with the network. Blue shaded triangles represent down-regulated microRNAs specific to HpSC-ICC tumors. The open ovals that are labeled as TGF-β, Smad4 and NF-κB represent molecular nodes related to their respective signaling pathways. Arrows represent positive regulation of gene expression, with solid arrows indicating direct regulation and broken arrows indirect regulation. Blue lines connecting between microRNA and genes represent direct targeting predicted by TargetScan.
Figure 5
Figure 5
Inactivation of miR-200c/miR-141 and activation of EMT-related genes are associated with stem-like ICC. (A) Expression analyses of miR-141/miR-200c transcripts and EMT-specific markers based qRT-PCR data in 8 HpSC-ICC and 8 MH-ICC samples classified by gene clustering from Figure 1. The horizontal lines in the box plots represent the median, the boxes represent the interquartile range, and the whiskers represent the 10th and 90th percentiles. A nonparametric test was used to compare the two groups and p values are indicated. (B) Expression of miR-200c and EMT-specific genes in HuH28, HuCCT1 and H69 cells as analyzed by qRT-PCR. (C) Expression of EMT-specific genes in HuH28 cells transduced with miR-200c as analyzed by qRT-PCR. (D) Expression of EMT-specific genes in HuCCT1 cells transduced with an anti-miR-200c oligo as analyzed by qRT-PCR. (E) Cell migration of HuH28 cells transduced with miR-200c as determined by the wound healing assay. (F) Cell invasion of HuH28 cells transduced with miR-200c as determined by the Boyden chamber cell invasion assay. Representative images are shown.
Figure 6
Figure 6
c-Myc-mediated silencing of miR-200c and induction of EMT. (A) The genome position of ENST00000537269 encoding miR-200c and miR-141, based on Ensembl Gene Predictions using UCSC Genome Browser. (B) Effect of c-Myc siRNA on miR-200cc-Myc expression (left panel) and the miR-200c promoter luciferase activity (right panel) in HuCCT1 cells. (C) Effect of c-Myc siRNA on endogenous levels of miR-200c and induction of EMT-related gene expression in HuCCT1 cells.
Figure 7
Figure 7
Functional interactions between miR-200c and NCAM1. (A) Predicted duplex formation between the 3′UTR sequences of human NCAM1 and miR-200c where vertical bars represent the paired seed sequences. The box highlights the the nucleotides that were changed to CAUAA in a mutant luciferase reporter. (B) Effect of premiR-200c oligo on NCAM1 expression in HuH28 cells as determined by qRT-PCR. (C) Effect of anti-miR-200c oligo on NCAM1 expression in HuCCT1 cells as determined by qRT-PCR. (D) Luciferase activities of wild-type and mutant reporters in HuH28 cells with or without the presence of pre-miR-200c oligo. (E) Luciferase activities of wild-type and mutant reporters in HuCCT1 cells with or without the presence of anti-miR200c oligo. Each experiment was repeated at least three times, and the expression value was shown as the mean ± standard deviation. (F) Kaplan-Meier estimates of overall survival according to expression of NCAM1 in ICC cases from LCS and SNU cohorts. NCAM1 expression values were dichotomized into low and high groups using the within cohort median expression value as a cutoff. (G) Spearman correlation analysis of NCAM1 and miR-200c expression data as determined by mRNA and microRNA arrays.

References

    1. Jemal A, Bray F, Center MM, Ferlay J, Ward E, Forman D. Global cancer statistics. CA Cancer J Clin. 2011;61:69–90. - PubMed
    1. Martin R, Jarnagin W. Intrahepatic cholangiocarcinoma. Current management Minerva Chir. 2003;58:469–478. - PubMed
    1. Shaib Y, El-Serag HB. The epidemiology of cholangiocarcinoma. Semin Liver Dis. 2004;24:115–125. - PubMed
    1. Berthiaume EP, Wands J. The molecular pathogenesis of cholangiocarcinoma. Semin Liver Dis. 2004;24:127–137. - PubMed
    1. Komuta M, Spee B, Vander BS, De VR, Verslype C, Aerts R, et al. Clinicopathological study on cholangiolocellular carcinoma suggesting hepatic progenitor cell origin. Hepatology. 2008;47:1544–1556. - PubMed

Publication types