. 2012 Oct;26(10):4045-56.
doi: 10.1096/fj.12-211441. Epub 2012 Jun 15.

Physical confinement alters tumor cell adhesion and migration phenotypes

Affiliations

Physical confinement alters tumor cell adhesion and migration phenotypes

Eric M Balzer et al. FASEB J. 2012 Oct.

Abstract

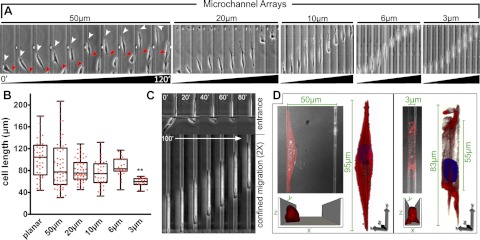
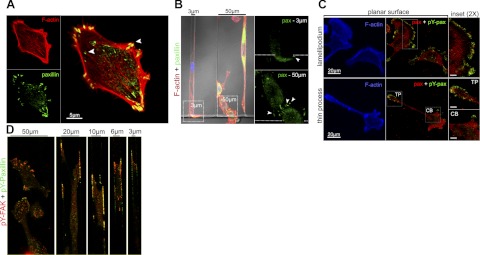
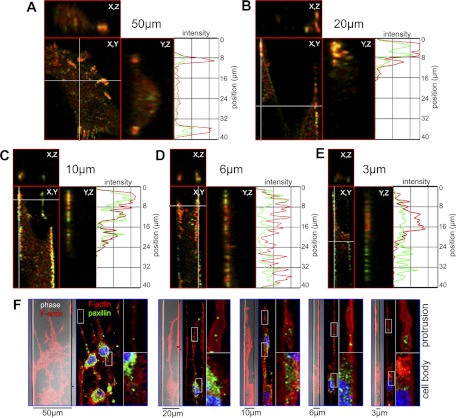
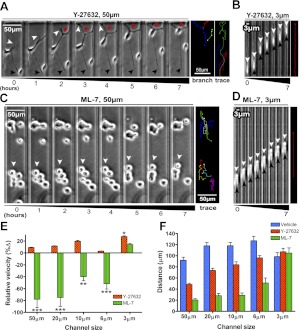
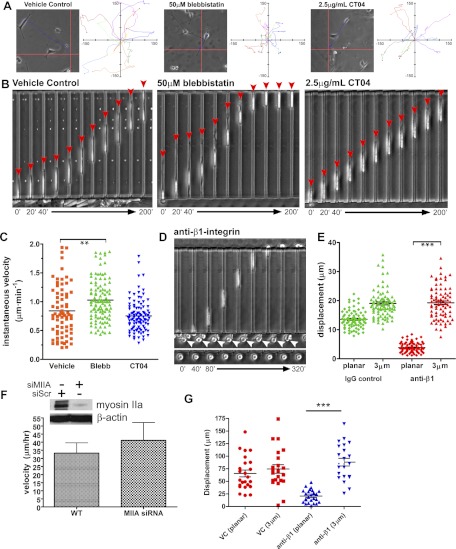
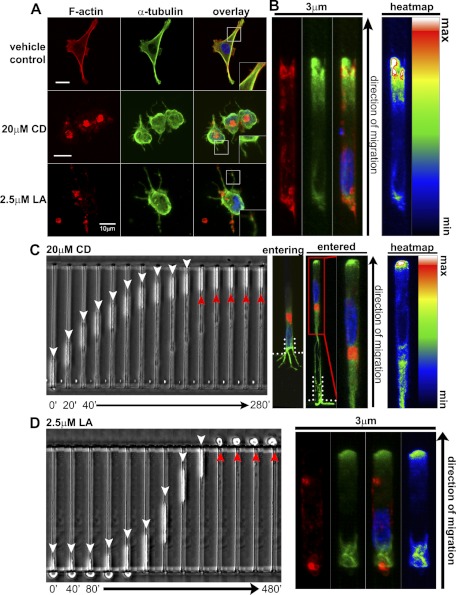
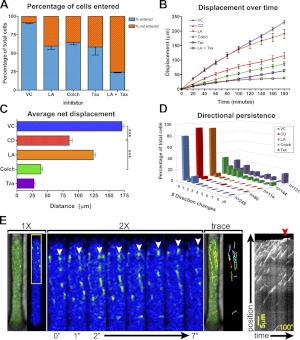
Cell migration on planar surfaces is driven by cycles of actin protrusion, integrin-mediated adhesion, and myosin-mediated contraction; however, this mechanism may not accurately describe movement in 3-dimensional (3D) space. By subjecting cells to restrictive 3D environments, we demonstrate that physical confinement constitutes a biophysical stimulus that alters cell morphology and suppresses mesenchymal motility in human breast carcinoma (MDA-MB-231). Dorsoventral polarity, stress fibers, and focal adhesions are markedly attenuated by confinement. Inhibitors of myosin, Rho/ROCK, or β1-integrins do not impair migration through 3-μm-wide channels (confinement), even though these treatments repress motility in 50-μm-wide channels (unconfined migration) by ≥50%. Strikingly, confined migration persists even when F-actin is disrupted, but depends largely on microtubule (MT) dynamics. Interfering with MT polymerization/depolymerization causes confined cells to undergo frequent directional changes, thereby reducing the average net displacement by ≥80% relative to vehicle controls. Live-cell EB1-GFP imaging reveals that confinement redirects MT polymerization toward the leading edge, where MTs continuously impact during advancement of the cell front. These results demonstrate that physical confinement can induce cytoskeletal alterations that reduce the dependence of migrating cells on adhesion-contraction force coupling. This mechanism may explain why integrins can exhibit reduced or altered function during migration in 3D environments.


Figures

Figure 1.
Figure 1.
Physical confinement alters the migratory phenotype. A) Time lapse of cells within each channel. Arrowheads indicate front (white) and rear (red) of a cell in a 50-μm channel. B) Contraction along the migratory axis in 50-μm channels results in variability in cell length that is suppressed as a function of decreasing channel width. Significance of difference between mean for planar and 3-μm groups was calculated via 1-way ANOVA and a post hoc Tukey test. **P < 0.001. C) Cell entering and migrating through a 3-μm channel is shown at 20-min intervals. D) Volumetric reconstructions of cells in 50-μm and 3-μm channels (red, F-actin; blue, Hoescht). Schematics at bottom depict orientation of the cell (channel ceiling not pictured).
Figure 2.
Figure 2.
Confinement suppresses focal adhesions. A) Cell on a planar surface stained for paxillin (green) and F-actin (red). Arrowheads indicate FAs at the cell periphery and tips of stress fibers. B) Comparison of cells in contiguous 3-μm and 50-μm channels. Insets: magnified view of paxillin signal within boxed region at channel entrances (arrowheads indicate FAs; dotted line depicts threshold to channel entrance). C) Cells on planar surface stained for F-actin (blue), total paxillin (red), and pY-paxillin (green). Insets: magnified views of boxed regions for a broad membrane ruffle (top panel), thin protrusion (TP), and cell body (CB); scale bars = 5 μm. D) Representative images of cells within each channel type stained for pY-FAK (red) and pY-paxillin (green).
Figure 3.
Figure 3.
pY-FAK and pY-paxillin are evenly distributed along the migratory axis as a function of increasing confinement. A–E) Ventral (X,Y) and orthogonal (Y,Z; X,Z) views of pY-FAK (red) and pY-paxillin (green) for a 3D volume encompassing the leading edge of a cell for each channel type. Intensity profiles of lateral views (Y,Z) are plotted along the migratory axis for both pY-FAK and pY-paxillin (length 40 μm). F) ROCK inhibition blocks FA formation. Cells were treated with the p160ROCK inhibitor Y-27632 (30 μM). Phase-contrast images (phase) overlaid with F-actin (red) show cell orientation and fluorescent panels depict paxillin (green). Insets: ×4 views of boxed regions showing protrusions (top) and cell body (bottom).
Figure 4.
Figure 4.
Cell contractility is not required for confined migration. A) Cell in a 50-μm channel in the presence of 30 μM Y-27632. Thin protrusions at the leading edge (white arrowheads) underwent excessive branching (red arrowhead), and the trailing regions of the cell failed to contract (black arrowheads). Trajectories are shown for growing protrusions (branch) and overall cell displacement (trace). B) Cell in a 3-μm channel migrating in the presence of 30 μM Y-27632. Distance between the leading and trailing edges remained constant (white and black arrowheads, respectively); a trajectory depicts steady forward progress of the cell (trace). C) Cells in 50-μm channels in the presence of 20 μM ML-7 were relatively immobile (arrowheads). D) Cells migrated efficiently through 3-μm channels in the presence of ML-7. E) Cells migrating in the presence of the p160ROCK inhibitor Y-27632 (20 μM) and the MLCK inhibitor ML-7 (30 μM) were compared; cell velocity is plotted as a percentage change relative to vehicle control. *P < 0.01, **P < 0.001, ***P < 0.0001 vs. control; Student's t test. F) Average net displacement of cells treated with Y-27632 (20 μM), ML-7 (30 μM), or vehicle control over a period of 200 min. Values are means ± se.
Figure 5.
Figure 5.
Confinement suppresses the roles of contraction and integrins in migration. A) Representative trajectory for cells treated with vehicle control, 50 μM blebbistatin, and 2.5 μg/ml CT04 (grid origin denotes starting point). Ten trajectories are plotted for each condition (grid units: μm). B) Representative time-lapse images depicting migration through 3-μm channels (red arrows indicate cell front). C) Plot of instantaneous velocity for each condition. D) Treatment with a β1-integrin blocking antibody abolished migration outside the channels (bottom panel and bottom of top panel, arrowheads), but had no effect on migration through 3-μm channels (top panel). E) Average net displacement of cells with or without anti-β1 in planar regions and 3-μm channels. Values are means ± se. F) Pa03C pancreatic tumor cells were treated with siRNA targeting myosin IIA or a scramble control, as indicated by the Western blot depicting an immunoblot for myosin IIA. Migration velocities for both wild-type and siRNA-transfected cells are shown. G) Inhibiting integrins in Pa03C cells does not inhibit migration in confinement. Treatment with an anti-β1 integrin function-blocking antibody abolished cell movement outside the channels but had no effect on the net displacement through 3-μm channels. Three independent trials were performed. **P < 0.001, ***P < 0.0001; Student's t test.
Figure 6.
Figure 6.
Inhibition of actin polymerization does not block migration in confinement. A) F-actin and α-tubulin after treatment with vehicle control, CD, or LA. MT protrusions formed in CD- and LA-treated cells. F-actin aggregates are also visible, but less prominent in LA-treated cells. Insets: ×2 views of boxed regions. B) Vehicle control cell migrating in a 3-μm channel. Intensity map depicts polarization of α-tubulin toward the cell front. C) Time-lapse image of a CD-treated cell entering a 3-μm channel (white arrowheads), but unable to exit (red arrowheads). Immunofluorescence analysis confirms F-actin disruption inside the channel and demonstrates the polarization of α-tubulin at the cell front in a CD-treated cell. D) LA-treated cell migrating through a 3-μm channel (red arrowhead indicates failure to spread and migrate on exiting the channel). Immunofluorescence confirmed the disruption of F-actin and polarity of α-tubulin.
Figure 7.
Figure 7.
Confinement promotes the role of MTs in migration. A) Percentage of cells that entered 3-μm channels is plotted as fraction of the total population analyzed. Drugs used were vehicle control (VC), 20 μM CD, 2.5 μM LA, 125 μM colchicine (Colch), and 1.2 μM Taxol (Tax). B) Cell displacement in the presence of each drug is plotted as mean ± se as a function of time. C) Average net displacement of cells over a period of 200 min, plotted for each inhibitor; 3 independent trials. ***P < 0.0001; Student's t test. D) Directional persistence of cells migrating in 3-μm channels, depicted as the fraction of cells that executed a defined number of direction changes over the course of 16 h. Number of cells analyzed (n) is indicated on the z axis. E) EB1-GFP revealed that nascent MT growth was polarized in the direction of the cell front (top of panel). Individual EB1 particles were tracked until they disappeared or impacted the leading edge (white arrowheads depict movement over a period of 7 s; an intensity color filter was applied to improve clarity of individual particles). EB1 motion is depicted with a particle trace. Kymograph depicts the gradual advancement of the cell membrane concomitant with EB1 impact (right panel, red arrowhead).

References

    1. Gardel M. L., Schneider I. C., Aratyn-Schaus Y., Waterman C. M. (2010) Mechanical integration of actin and adhesion dynamics in cell migration. Annu. Rev. Cell Dev. Biol. 26, 315–333 - PMC - PubMed
    1. Even-Ram S., Yamada K. M. (2005) Cell migration in 3D matrix. Curr. Opin. Cell Biol. 17, 524–532 - PubMed
    1. Beningo K. A., Dembo M., Wang Y. L. (2004) Responses of fibroblasts to anchorage of dorsal extracellular matrix receptors. Proc. Natl. Acad. Sci. U. S. A. 101, 18024–18029 - PMC - PubMed
    1. Lakshman N., Kim A., Bayless K. J., Davis G. E., Petroll W. M. (2007) Rho plays a central role in regulating local cell-matrix mechanical interactions in 3D culture. Cell Motil. Cytoskeleton 64, 434–445 - PubMed
    1. Poincloux R., Collin O., Lizarraga F., Romao M., Debray M., Piel M., Chavrier P. (2011) Contractility of the cell rear drives invasion of breast tumor cells in 3D matrigel. Proc. Natl. Acad. Sci. U. S. A. 108, 1943–1948 - PMC - PubMed

Publication types

MeSH terms

LinkOut - more resources