. 2011 Jan 1;83(12):2153-2169.
doi: 10.1351/PAC-CON-11-08-25. Epub 2011 Oct 31.

Design, synthesis, and characterization of novel nanowire structures for photovoltaics and intracellular probes

Affiliations

Design, synthesis, and characterization of novel nanowire structures for photovoltaics and intracellular probes

Bozhi Tian et al. Pure Appl Chem. .

Abstract

Semiconductor nanowires (NWs) represent a unique system for exploring phenomena at the nanoscale and are expected to play a critical role in future electronic, optoelectronic, and miniaturized biomedical devices. Modulation of the composition and geometry of nanostructures during growth could encode information or function, and realize novel applications beyond the conventional lithographical limits. This review focuses on the fundamental science aspects of the bottom-up paradigm, which are synthesis and physical property characterization of semiconductor NWs and NW heterostructures, as well as proof-of-concept device concept demonstrations, including solar energy conversion and intracellular probes. A new NW materials synthesis is discussed and, in particular, a new "nanotectonic" approach is introduced that provides iterative control over the NW nucleation and growth for constructing 2D kinked NW superstructures. The use of radial and axial p-type/intrinsic/n-type (p-i-n) silicon NW (Si-NW) building blocks for solar cells and nanoscale power source applications is then discussed. The critical benefits of such structures and recent results are described and critically analyzed, together with some of the diverse challenges and opportunities in the near future. Finally, results are presented on several new directions, which have recently been exploited in interfacing biological systems with NW devices.


Figures

Fig. 1
Fig. 1. Design and controlled synthesis of multiply kinked NWs
A, Schematic of a coherently kinked NW and the SBU, which contains two arms (blue) and one joint (green). Subscripts c and h denote cubic and hexagonal structures, respectively. B, Cycle for the introduction of an SBU by stepwise synthesis. The color gradient accompanying the innermost blue arrows indicates the change of Si concentration in nanocluster catalyst during synthesis of a kinked Si-NW. C, SEM image of a multiply kinked 2D Si-NW with equal (upper panel) and decreasing (lower panel) arm segment lengths. Scale bar, 1 μm. The yellow arrow highlights the position of the nanocluster catalyst. D, Plot of segment length vs. growth time. Each blue diamond represents average segment length data (error bars: ±1 s.d.) from a sample containing NWs with uniform segment lengths between kinks. The green line is a linear fit to these data. Magenta solid squares are data points taken from the NW shown in C (lower panel). Inset, growth pressure variation during kink synthesis. The black solid sphere and square denote the start of purging and re-introduction of reactants, respectively.
Fig. 2
Fig. 2. Topologically defined nanoelectronic devices
A, I–V data recorded from a kinked p-n Si-W device. Inset, SEM image of the device structure; scale bar is 2 μm. B, Electrostatic force microscopy image of a p-n diode reverse-biased at 5 V. The AFM tip voltage was modulated by 3 V at the cantilever-tip resonance frequency. The signal brightness is proportional to the NW device surface potential, and shows an abrupt drop around the kink position. The dashed lines mark the NW position. Scale bar is 2 μm. C and D, AFM and scanning gate microscopy images of one n+-kink-n+-kink-(n-n+) dopant-modulated double-kinked Si-NW structure. The scale bar in c is 2 μm. The scanning gate images were recorded with a Vtip of 10 V (I) and −10 V (II), respectively, and Vsd of 1 V. The dark and bright regions correspond to reduced and enhanced conductance, respectively. The black dashed lines mark the NW position.
Fig. 3
Fig. 3. Structural characterization of type I branched NW heterostructures
A, SEM image of Si/Au-branched NWs. B, High-resolution transmission electron microscopy (HRTEM) image of Si/Au branched junction; red arrow highlights twin plane. C, Selected-area electron diffraction (SAED) pattern of the junction region shown in (B), where blue and green spots originate from <100>Au, <112>Au zone diffraction, and yellow spots are from the crystalline Si backbone. (inset) Cross-sectional model of the penta-twinned Au branch consisting of five twinned subunits. Red arrow marks the incident beam direction. D–F, SEM images of Si/Ge (D), Si/GaAs (E), and Si/GaP (F) branched NWs. G and H, HRTEM images of Si/Ge (G) and Si/GaAs (H) branched junctions. I, Simulated von Mises stress field at Si/GaAs branched junction. The scale bar range is from 3.1 × 10⁶ to 1.6 × 10¹⁰ Pa.
Fig. 4
Fig. 4. Single NW photovoltaics
A, Schematic of carrier generation and separation in axial (upper) and radial (lower) p-i-n NWs. The pink, yellow, and blue regions denote the p-type, i-, and n-type diode segments, respectively. The pink and blue spheres denote the holes and electrons, respectively. B, Dark and light I–V curves of a coaxial Si-NW device. C, Real-time detection of the voltage drop across a modified Si-NW at different pH values. The Si-NW pH sensor is powered by a single Si-NW PV device. D, NW AND logic gate powered by two Si-NW PV devices in series.
Fig. 5
Fig. 5. New NW structures to improve energy conversion efficiency
A, Schematic of MQW NW solar cell. Pink and blue regions denote p- core and n- shell, respectively; yellow and orange regions are barriers and quantum wells in the i-shell, respectively. B, Band structure and carrier transport schematics of MQW NW solar cell. C, Bright-field TEM image of a 26 MQW NW cross-section. The dashed line indicates the heterointerface between the core and shell.
Fig. 6
Fig. 6. 2D mapping of heterogeneous activities in the pyramidal cell layer
A, Optical image of an acute slice over a 4 × 4 NW FET array. Signals were recorded simultaneously from the 8 devices indicated on the image. Crosses along the LOT fiber region of the slice mark the stimulation spots a through h. The stimulator insertion depth was not controlled precisely in these experiments. Scale bar represents 100 μm. B, Signals recorded for devices 1–8 when stimulated with a 200 μs 400 μA pulse. Data are averaged from 15 recordings. The shaded area in each trace corresponds to the p-spike and was used to obtain normalized intensity (see Methods). Inset: normalized map of the signal intensity from the 8 devices. C, Representative signals recorded from devices 1 and 8 when stimulating at spots a through h, with 200 μs, 100 μA pulse. Data are averaged from 12 recordings. D, Maps of the relative signal intensity or activity for devices 1–8. E, Correlation between devices 1 and 8 (upper plot) and devices 3 and 4 (lower plot) for the different stimulation positions. The dashed black line marks signals that are correlated. The dotted blue lines mark the uncertainty owing to device signal fluctuations determined from correlation analysis.
Fig. 7
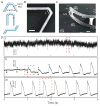
Fig. 7. Nanoscale intracellular FET probes
A, Schematics of 60° (top) and 0° (middle) multiply kinked NWs and cis (top) and trans (bottom) configurations in NW structures. The blue and pink regions designate the source/drain (S/D) and nanoscale FET channel, respectively. B, SEM image of a doubly kinked NW with a cis configuration. L is the length of segment between two adjacent kinks. Scale bar, 200 nm. C, SEM of an as-made device. The yellow arrow and pink star mark the nanoscale FET and SU-8, respectively. Scale bars, 5 μm. D, Electrical recording from beating cardiomyocytes: (i) extracellular recording, (ii) transition from extracellular to intracellular recordings during cellular entrance, and (iii) steady-state intracellular recording. Green and pink stars denote the peak positions of intra- and extracellular signal components, respectively.

References

    1. Hu JT, Odom TW, Lieber CM. Acc Chem Res. 1999;32:435.
    1. Lieber CM. MRS Bull. 2003;28:486.
    1. Cui Y, Duan X, Huang Y, Lieber CM. In: Nanowires and Nanobelts: Materials, Properties and Devices. Wang ZL, editor. Kluwer Academic; 2003.
    1. Huang Y, Lieber CM. Pure Appl Chem. 2004;76:2051.
    1. Lauhon LJ, Gudiksen MS, Lieber CM. Philos Trans R Soc London, Ser A. 2004;362:1247. - PubMed

LinkOut - more resources