. 2011 Aug 1;107(3-4):615-624.
doi: 10.1007/s10584-011-0112-y.

Observational and model evidence of global emergence of permanent, unprecedented heat in the 20(th) and 21(st) centuries

Affiliations

Observational and model evidence of global emergence of permanent, unprecedented heat in the 20(th) and 21(st) centuries

Noah S Diffenbaugh et al. Clim Change. .

Abstract

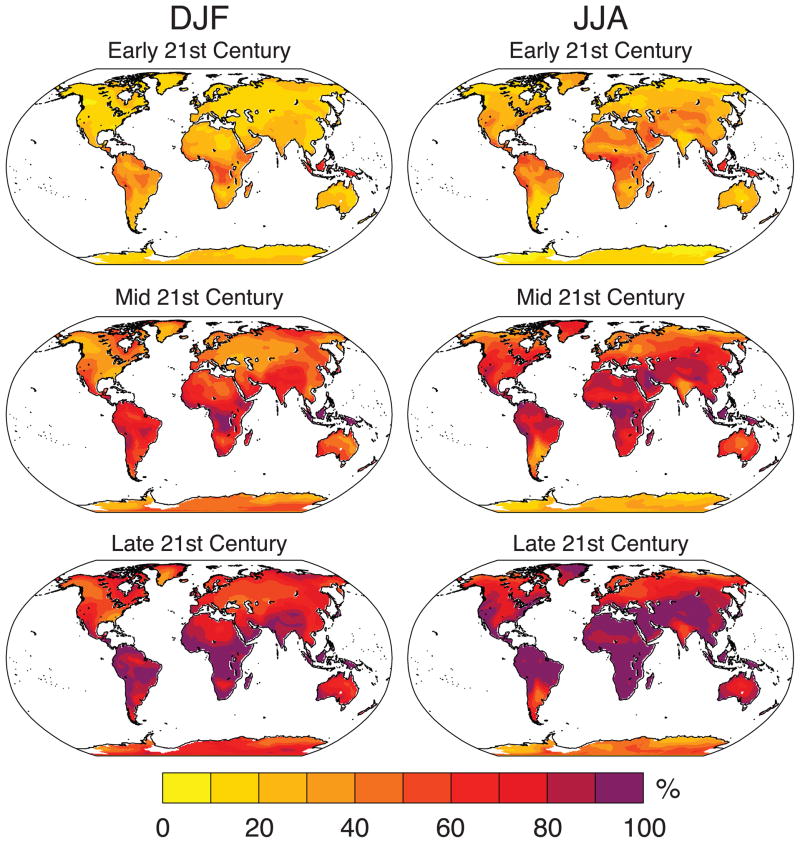
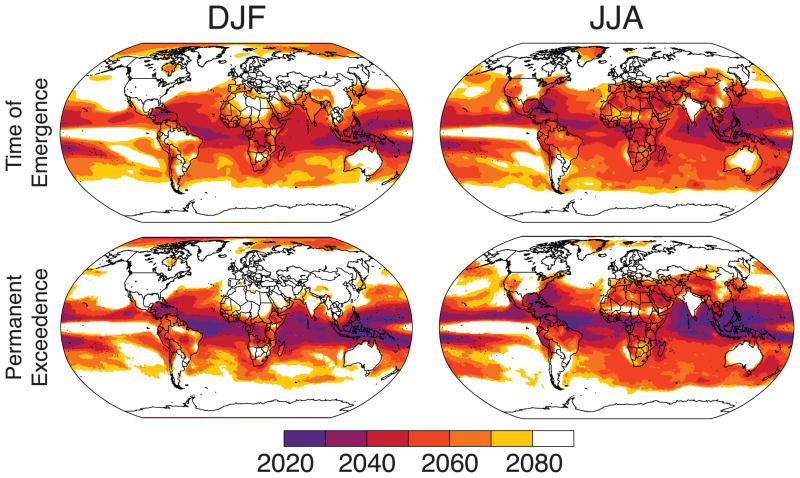
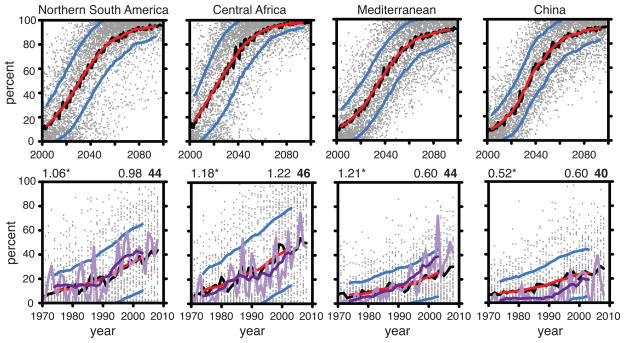
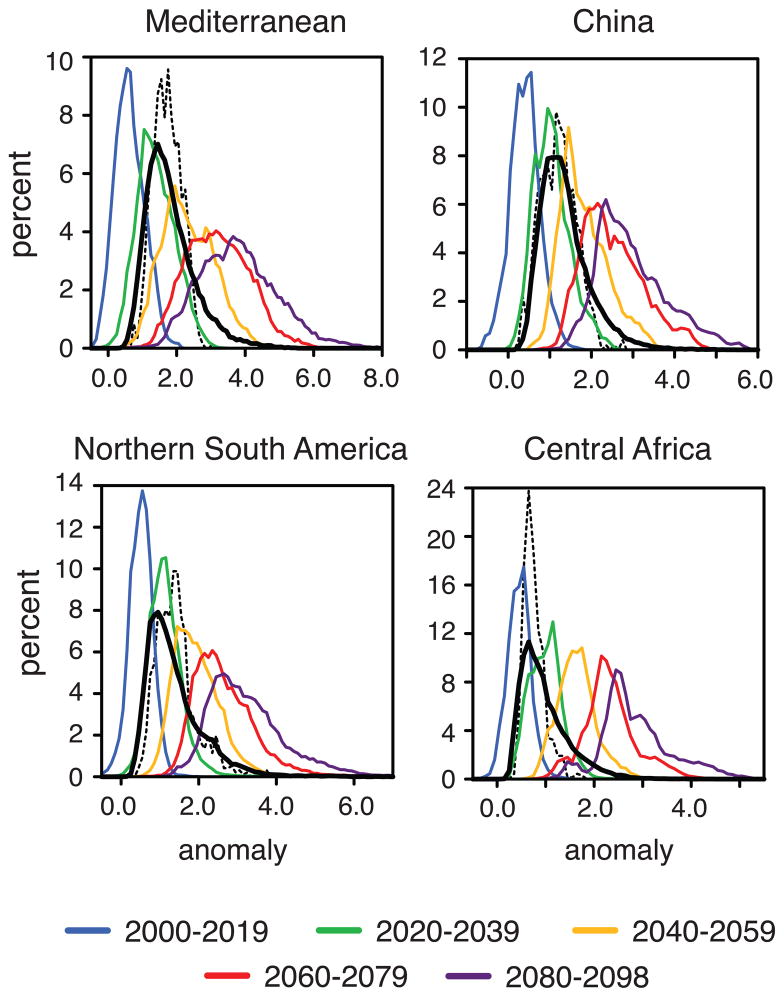
Given the severe impacts of extreme heat on natural and human systems, we attempt to quantify the likelihood that rising greenhouse gas concentrations will result in a new, permanent heat regime in which the coolest warm-season of the 21(st) century is hotter than the hottest warm-season of the late 20(th) century. Our analyses of global climate model experiments and observational data reveal that many areas of the globe are likely to permanently move into such a climate space over the next four decades, should greenhouse gas concentrations continue to increase. In contrast to the common perception that high-latitude areas face the most accelerated response to global warming, our results demonstrate that in fact tropical areas exhibit the most immediate and robust emergence of unprecedented heat, with many tropical areas exhibiting a 50% likelihood of permanently moving into a novel seasonal heat regime in the next two decades. We also find that global climate models are able to capture the observed intensification of seasonal hot conditions, increasing confidence in the projection of imminent, permanent emergence of unprecedented heat.


Figures

Figure 1
Figure 1
The percentage of seasons in the CMIP3 A1B ensemble for which the surface air temperature exceeds the warmest season of the 1980–1999 period. The early 20th century period is 2010–2039, the mid 20th century period is 2040–2069, and the late 20th century period is 2070–2098.
Figure 2
Figure 2
Decade of emergence of extreme surface air temperature. The top row shows the time of emergence (TOE) of the ensemble signal, calculated as the decade in which the ensemble mean seasonal temperature difference from the 1980–1999 maximum becomes permanently greater than the spread (one standard deviation) between the individual member differences from the 1980–1999 maximum. The second row shows the decade of the last occurrence of a season that is cooler than the 1980–1999 maximum, calculated as the median of the values across the CMIP3 ensemble. We cannot confirm whether the exceedence is permanent beyond the end of the 21st century, and therefore eliminate dates after 2080. Further details of both metrics are given in the text, and in Fig. S1.
Figure 3
Figure 3
Time series of exceedence of historical temperature extreme. Top row: Time series of the fraction of land grid points with JJA surface air temperatures above the respective 1980–1999 maximum. Bottom row: Time series of the fraction of land grid points with JJA surface air temperatures above the respective 1952–1969 maximum. The grey points denote this fraction for each CMIP3 model realization. The black curves show the mean across all realizations. The red curves show the 10-year running mean of the mean across all realizations. The blue curves show the 10-year running mean of a one-standard-deviation range across the mean of all realizations. The light purple shows the observational timeseries. The dark purple curves show the 10-year running mean of the observational timeseries. The regions cover land areas in Northern South America (25°S-3°N, 82-33°W), Central Africa (1°S–13°N, 18°W–51°E), the Mediterranean (28–50°N, 12°W–38°E), and China (21–43°N, 97–123°E). The trend in the observational timeseries (% per year) is shown in the upper left of the bottom panels, with those trends that are statistically significant identified with a *. The mean of the trends in the CMIP3 realizations is shown in the upper right of the bottom panels, with the number of realizations that exhibit a statistically significant trend shown in bold.
Figure 4
Figure 4
Probability density function (PDF) of JJA surface air temperature anomalies over land for four regions (Mediterranean, China, Northern South America and Central Africa). Each colored PDF represents anomalies for the CMIP3 ensemble for a 2-decade period of the 21st century (relative to the 1980–1999 period). The black lines show the PDF of the differences between the mean and maximum for the 1980–1999 period, with solid black lines showing the CMIP3 values and dashed lines showing the observed values. Regions are as in Figure 3.

Similar articles

Cited by

References

    1. Poumadere M, et al. The 2003 heat wave in France: Dangerous climate change here and now. Risk Analysis. 2005;25(6):1483–1494. - PubMed
    1. Patz JA, et al. Impact of regional climate change on human health. Nature. 2005;438(7066):310–317. - PubMed
    1. White MA, et al. Extreme heat reduces and shifts United States premium wine production in the 21st century. Proceedings of the National Academy of Sciences. 2006;103(30):11217–11222. - PMC - PubMed
    1. Schlenker W, Roberts MJ. Nonlinear temperature effects indicate severe damages to US crop yields under climate change. Proceedings of the National Academy of Sciences of the United States of America. 2009;106(37):15594–15598. - PMC - PubMed
    1. Battisti DS, Naylor RL. Historical Warnings of Future Food Insecurity with Unprecedented Seasonal Heat. Science. 2009;323(5911):240–244. - PubMed

LinkOut - more resources