. 2012 Jan 1;16(1):25-38.
doi: 10.1142/S1088424611004051.

Internal Spin Trapping of Thiyl Radical during the Complexation and Reduction of Cobalamin with Glutathione and Dithiothrietol

Affiliations

Internal Spin Trapping of Thiyl Radical during the Complexation and Reduction of Cobalamin with Glutathione and Dithiothrietol

Somasundaram Ramasamy et al. J Porphyr Phthalocyanines. .

Abstract

The activation of cobalamin requires the reduction of Cbl(III) to Cbl(II). The reduction by glutathione and dithiothreitol was followed using visible spectroscopy and electron paramagnetic resonance. In addition the oxidation of glutathione was monitored. Glutathione first reacts with oxidized Cbl(III). The binding of a second glutathione required for the reduction to Cbl(II) is presumably located in the dimethyl benzimidazole ribonucleotide ligand cavity. The reduction of Cbl(III) by dithiothreitol, which contains two thiols, is much faster even though no stable Cbl(III) complex is formed. The reduction, by both thiol reagents, results in the formation of thiyl radicals, some of which are released to form oxidized thiol products and some of which remain associated with the reduced cobalamin. In the reduced state the intrinsic lower affinity for the benzimidazole base, coupled with a trans effect from the initial GSH bound to the β-axial site and a possible lowering of the pH results in an equilibrium between base-on and base-off complexes. The dissociation of the base facilitates a closer approach of the thiyl radical to the Co(II) α-axial site resulting in a complex with ferromagnetic exchange coupling between the metal ion and the thiyl radical. This is a unique example of 'internal spin trapping' of a thiyl radical formed during reduction. The finding that the reduction involves a peripheral site and that thiyl radicals produced during the reduction remain associated with the reduced cobalamin provide important new insights into our understanding of the formation and function of cobalamin enzymes.


Figures
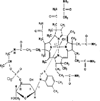
Figure 1
Figure 1
Molecular Structure of Cobalamin (III) with the OH in the β-axial site and the benzimidazole nucleotide in the α axial site.
Figure 2
Figure 2
a. Time-dependent UV-Vis spectral change monitored during the reaction of 3 fold excess of GSH with 100 µM Cbl(III)OH under anaerobic condition. The time taken for the complete formation of the Cbl(III)GSH complex is 8–9 min. The first spectrum corresponds to that of Cbl(III)OH. After a dead time of 10 sec., the accumulation of the spectra was initiated. The running time for each spectrum is 38 sec. b. Time-dependent UV-Vis spectral change during the reaction of 50 fold excess of GSH with 100µM Cbl(III)OH under anaerobic condition. The initial spectrum obtained after the 10 sec dead time is the same as that of Fig.2a at the end of the reaction with a 3:1 molar ratio of GSH and Cbl(III)OH. The subsequent reduction was followed for 5 Hrs. c. The UV-Vis spectra of the final product formed from 100µM Cbl(III)OH with a 50 fold excess GSH (-----) is compared with that obtained with a 3 fold excess of dithiothreitol (____).
Figure 2
Figure 2
a. Time-dependent UV-Vis spectral change monitored during the reaction of 3 fold excess of GSH with 100 µM Cbl(III)OH under anaerobic condition. The time taken for the complete formation of the Cbl(III)GSH complex is 8–9 min. The first spectrum corresponds to that of Cbl(III)OH. After a dead time of 10 sec., the accumulation of the spectra was initiated. The running time for each spectrum is 38 sec. b. Time-dependent UV-Vis spectral change during the reaction of 50 fold excess of GSH with 100µM Cbl(III)OH under anaerobic condition. The initial spectrum obtained after the 10 sec dead time is the same as that of Fig.2a at the end of the reaction with a 3:1 molar ratio of GSH and Cbl(III)OH. The subsequent reduction was followed for 5 Hrs. c. The UV-Vis spectra of the final product formed from 100µM Cbl(III)OH with a 50 fold excess GSH (-----) is compared with that obtained with a 3 fold excess of dithiothreitol (____).
Figure 3
Figure 3
a. Job’s plot from the UV-Vis spectral results for the reduction of Cbl(III)-OH with GSH. The fraction of reduced Cbl(II) for the Job’s plot was obtained by fitting the 3 hour spectra with the spectra of Cbl(III), Cbl(III)-GSH and Cbl(II) taken from Figures.2a and 2b. b. Job’s plot from the EPR spectral data for the reduction of Cbl(III)-OH when incubated with GSH for 3 Hrs. The intensity of Cbl(II) is directly measured.
Figure 3
Figure 3
a. Job’s plot from the UV-Vis spectral results for the reduction of Cbl(III)-OH with GSH. The fraction of reduced Cbl(II) for the Job’s plot was obtained by fitting the 3 hour spectra with the spectra of Cbl(III), Cbl(III)-GSH and Cbl(II) taken from Figures.2a and 2b. b. Job’s plot from the EPR spectral data for the reduction of Cbl(III)-OH when incubated with GSH for 3 Hrs. The intensity of Cbl(II) is directly measured.
Figure 4
Figure 4
Q band EPR spectrum of 5mM Cbl(III)-OH with 10 fold excess of GSH at 12 K (solid line) and its simulation requiring two different species (dotted line).
Figure 5
Figure 5
X-band EPR spectrum of 5mM Cbl(III)-OH to which a 50 fold excess of GSH is added and measured at 77 K.
Figure 6
Figure 6
a. X-band EPR spectrum at 77 K of Cbl(III)OH (5mM) reduced by DTT (20mM) at 77 K. b. X-band EPR spectrum at 77 K of Cbl(III)OH (5mM) reduced first by DTT (20mM) to which 250mM GSH was subsequently added.
Figure 7
Figure 7
a. X-band EPR spectrum at 77 K of 965µM Cobinamide, Cbi(III), reduced by 10mM DTT. b. X-band EPR spectrum at 77 K of 965µM Cobinamide, Cbi(III), reduced by 10mM DTT to which 50mM GSH was subsequently added (See text). c. (Middle) The X-band EPR spectrum of Cbi(III)OH reduced first by DTT and followed by GSH addition (the same as in Figure 7b reproduced for comparison with simulated spectra). (bottom) Computer Simulation of the species with g =2.39 which is attributed to the spectrum where the base is replaced by a second GSH (Cbl(II)(GSH)2 (F). (Top) Simulation of the exchange coupled species (E’). d. X-band EPR spectrum of Cbl(III) (5m) at pH 2 reduced directly by GSH. Measurement done at 8K at a microwave power of 0.02 mw. * and + respectively identify the g = 2.19 and the low intensity Ag (59Co) of the exchange coupled species.
Figure 7
Figure 7
a. X-band EPR spectrum at 77 K of 965µM Cobinamide, Cbi(III), reduced by 10mM DTT. b. X-band EPR spectrum at 77 K of 965µM Cobinamide, Cbi(III), reduced by 10mM DTT to which 50mM GSH was subsequently added (See text). c. (Middle) The X-band EPR spectrum of Cbi(III)OH reduced first by DTT and followed by GSH addition (the same as in Figure 7b reproduced for comparison with simulated spectra). (bottom) Computer Simulation of the species with g =2.39 which is attributed to the spectrum where the base is replaced by a second GSH (Cbl(II)(GSH)2 (F). (Top) Simulation of the exchange coupled species (E’). d. X-band EPR spectrum of Cbl(III) (5m) at pH 2 reduced directly by GSH. Measurement done at 8K at a microwave power of 0.02 mw. * and + respectively identify the g = 2.19 and the low intensity Ag (59Co) of the exchange coupled species.
Figure 8
Figure 8
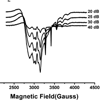
a. EPR power saturation measurement on sample of 965µM Cbi(III) reduced by GSH at 77 K. b. Temperature dependent EPR spectra of 965µM Cbi (III), first reduced by DTT and later reacted with GSH at a constant power of 40db (0.02mw).
Figure 8
Figure 8
a. EPR power saturation measurement on sample of 965µM Cbi(III) reduced by GSH at 77 K. b. Temperature dependent EPR spectra of 965µM Cbi (III), first reduced by DTT and later reacted with GSH at a constant power of 40db (0.02mw).
Figure 9
Figure 9
a. Power variation EPR measurement at 77 K of 5mM Cbl(III) at pH 2 reduced by 20mM DTT. b. Power variation EPR measurement at 77 K of 5mM Cbl(III) at pH 2 reduced by 250mM GSH. c. Power variation EPR measurement at 77 K of 5mM Cbl(III) at pH 2 first reduced by 20 mM DTT with 250mM GSH added subsequently.
Figure 9
Figure 9
a. Power variation EPR measurement at 77 K of 5mM Cbl(III) at pH 2 reduced by 20mM DTT. b. Power variation EPR measurement at 77 K of 5mM Cbl(III) at pH 2 reduced by 250mM GSH. c. Power variation EPR measurement at 77 K of 5mM Cbl(III) at pH 2 first reduced by 20 mM DTT with 250mM GSH added subsequently.
Figure 10
Figure 10
The EPR spectra describing the effect of lowering the pH on DTT reduced cobalamin: (a) cobalamin reduced by DTT at pH 7.4; (b) the pH of the DTT-reduced cobalamin was then lowered to pH 2.
Scheme I
Scheme I
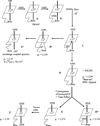
Sequence of reduction of Cbl(III)OH with GSH.

Similar articles

Cited by

References

    1. McCaddon A, Regland B, Hudson P, Davies D. Neurology. 2002;58:1395–1399. - PubMed
    1. Kelly PJ, Rosand J, Kistler JP, Shih VE, Silveira S, Plomaritoglou A, Furie KL. Neurology. 2002;59:529–536. - PubMed
    1. Miyao Y, Fujimoto K, Kugiyama K, Kawano H, Hirai N, Sugiyama S, Sakamoto T, Yoshimura M, Ogawa H. Thrombosis Research. 2003;112:123–129. - PubMed
    1. Graham M, O’Callghan P. Cardiovascular drugs and therapy. 2002;16:383–389. - PubMed
    1. Wang FC, De Pasqua V, Gérard P, Delwaide PJ. Neurology. 2001;57:897–899. - PubMed

LinkOut - more resources