. 2012 Jun 13:3:193.
doi: 10.3389/fpsyg.2012.00193. eCollection 2012.

The attentional drift-diffusion model extends to simple purchasing decisions

Affiliations

The attentional drift-diffusion model extends to simple purchasing decisions

Ian Krajbich et al. Front Psychol. .

Abstract

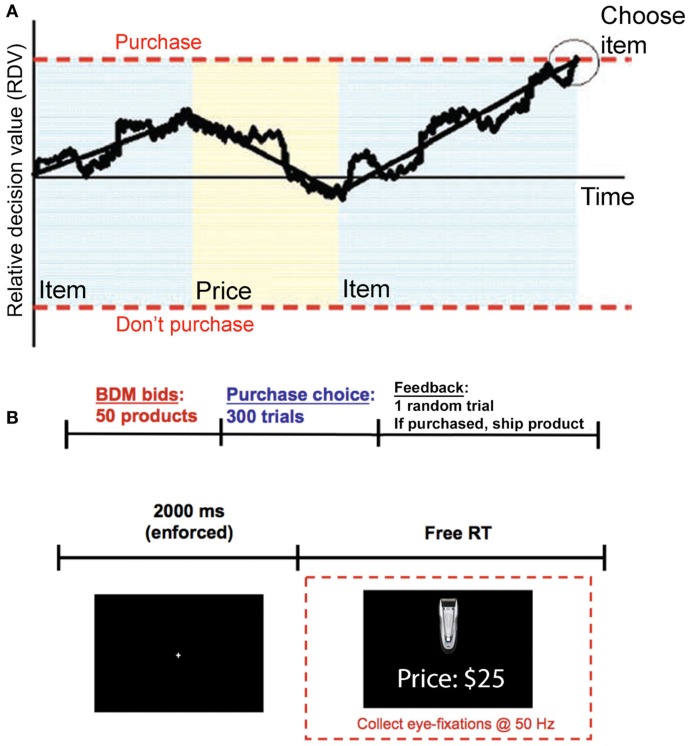
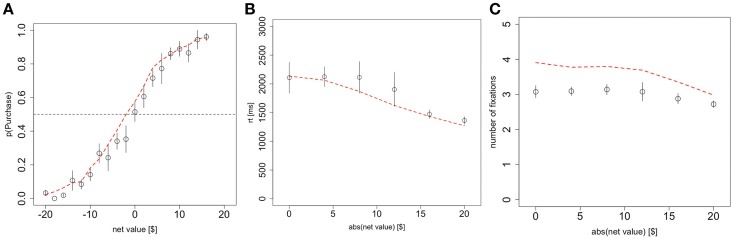
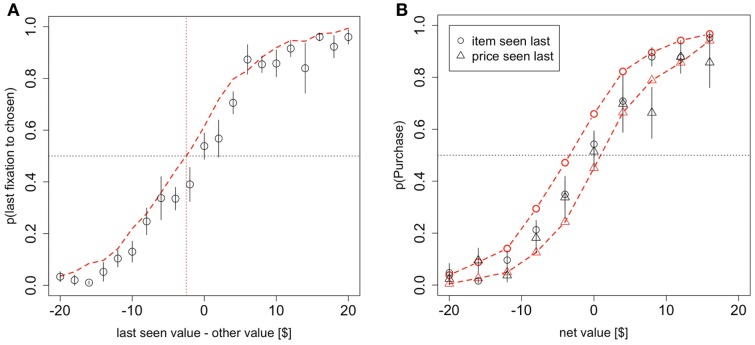
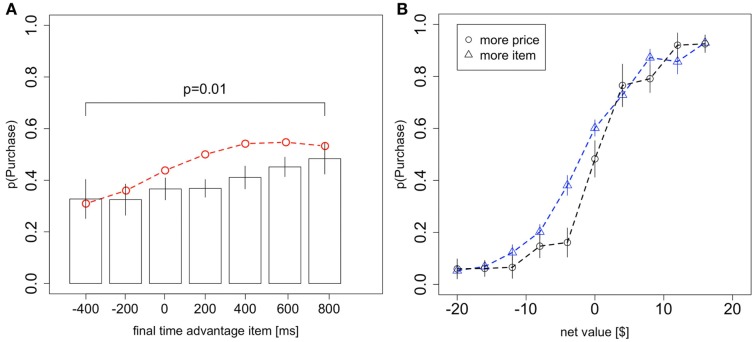
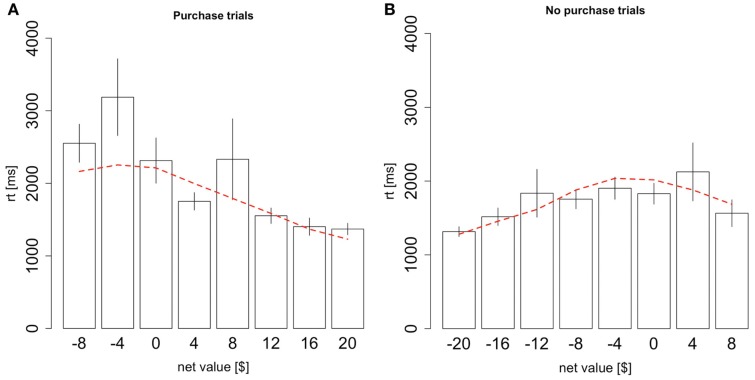
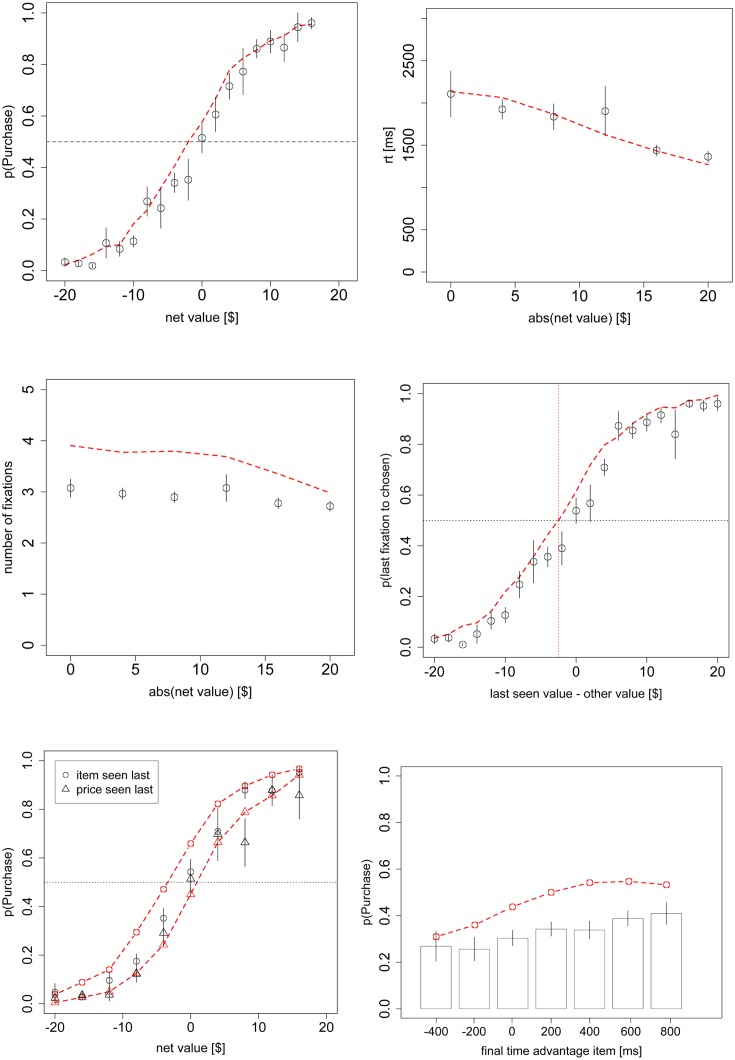
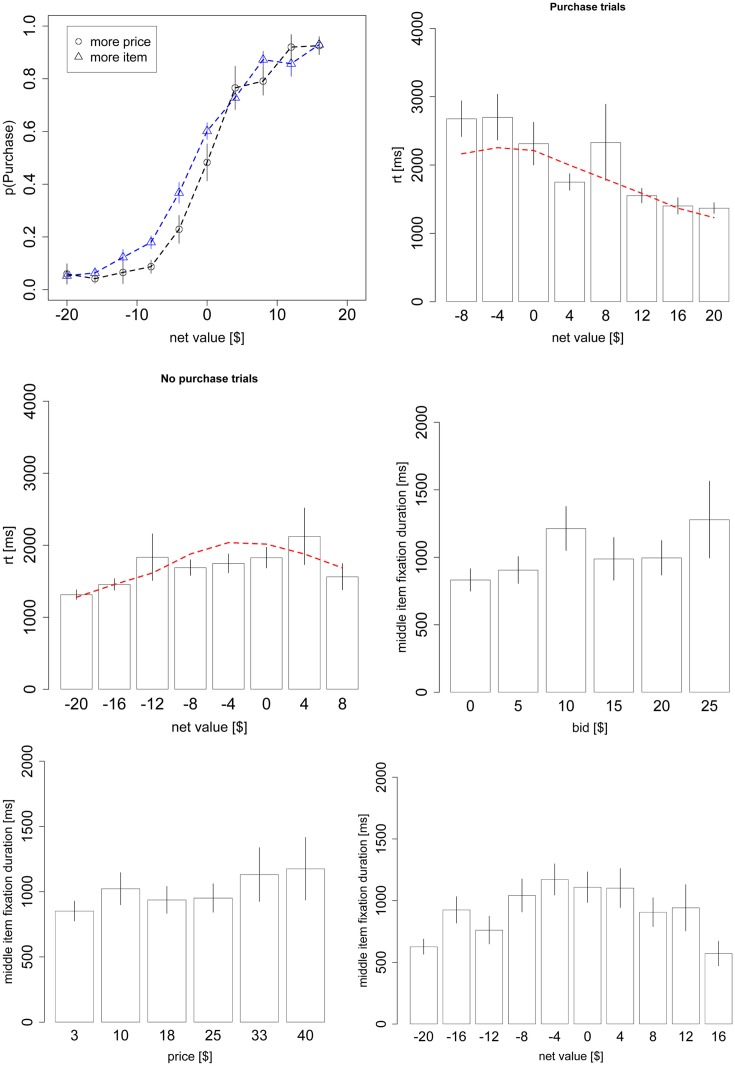
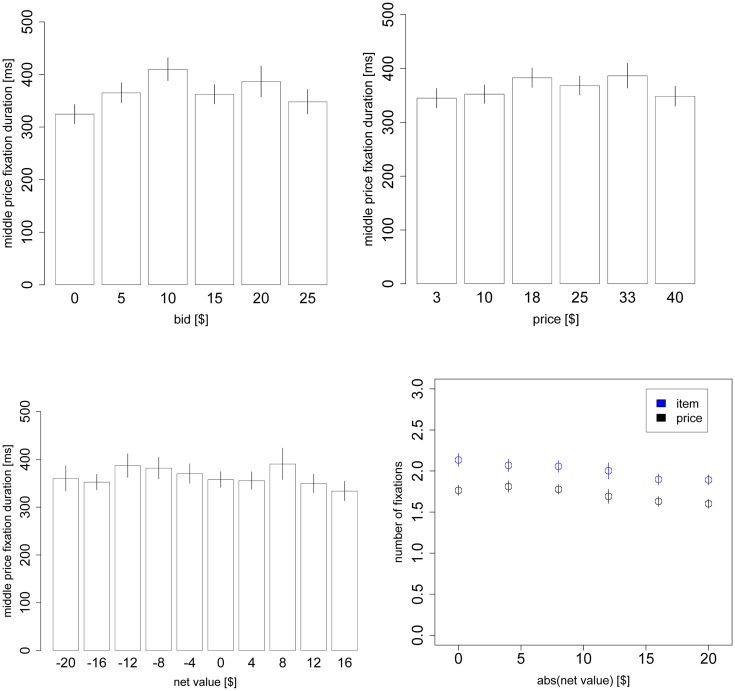
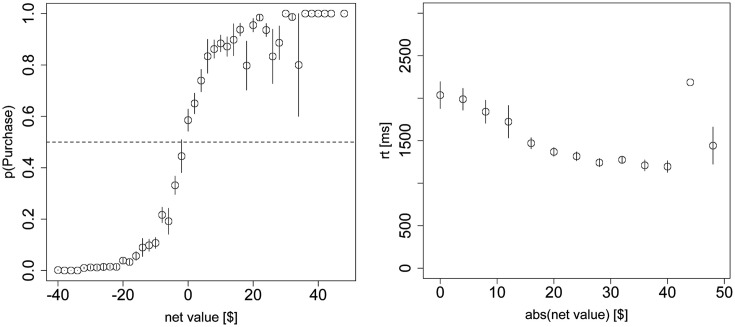
How do we make simple purchasing decisions (e.g., whether or not to buy a product at a given price)? Previous work has shown that the attentional drift-diffusion model (aDDM) can provide accurate quantitative descriptions of the psychometric data for binary and trinary value-based choices, and of how the choice process is guided by visual attention. Here we extend the aDDM to the case of purchasing decisions, and test it using an eye-tracking experiment. We find that the model also provides a reasonably accurate quantitative description of the relationship between choice, reaction time, and visual fixations using parameters that are very similar to those that best fit the previous data. The only critical difference is that the choice biases induced by the fixations are about half as big in purchasing decisions as in binary choices. This suggests that a similar computational process is used to make binary choices, trinary choices, and simple purchasing decisions.

Keywords: choice; decision neuroscience; decision-making; drift-diffusion; eye-tracking; neuroeonomics; purchasing; valuation.


Figures

Figure 1
Figure 1
Model and experiment. (A) Model. A relative decision value (RDV) evolves over time with a slope that depends on what the subject is looking at. In addition to the average drift, there is also Gaussian noise. When the RDV reaches one of the two barriers the subject makes the corresponding choice. The shaded regions indicate what the subject is currently looking at, blue for the product and yellow for the price. (B) Timeline. (Top) Subjects first reveal how much they are willing to pay for each of the 50 products, using a BDM auction. Then subjects make 300 purchasing choices (the 50 products at six different prices). At the end of the experiment one trial from the combined tasks is randomly chosen and the subject is paid and/or is shipped the chosen product. (Bottom) Within a choice trial, subjects must first fixate at the center of the screen for 2 s. They are then presented with an item and a price and given unlimited self-paced time to decide whether to buy the item at that price.
Figure 2
Figure 2
Basic psychometrics. (A) Probability of purchasing the product as a function of the net value (product value – price). (B) Reaction times as a function of the magnitude of the net value. (C) The number of fixations in a trial, as a function of the magnitude of the net value. Black circles indicate data from the odd-numbered trials of the subject data, and red dashed lines indicate the simulated data from the aDDM. Bars are standard error bars, clustered by subject.
Figure 3
Figure 3
Model predictions and results. (A) The probability that the last fixation of the trial is to the chosen stimulus (product or money) as a function of the difference in value between the last-seen stimulus and the other stimulus. (B) The probability of purchasing the item as a function of net value, contingent on whether the last fixation was to the product or to the price. Black circles indicate data from the odd-numbered trials of the subject data, and red dashed lines indicate the simulated data from the aDDM. Bars are standard error bars, clustered by subject.
Figure 4
Figure 4
Choice biases. (A) The probability of purchasing the item as a function of the difference in total fixation time (over the whole trial) between the product and the price. Black circles indicate data from the odd-numbered trials of the subject data, and the red dashed line indicates the simulated data from the aDDM. The p-value is from a one-sided t-test. (B) The probability that the product is chosen as a function of the net value, conditional on whether more time was spent looking at the product or the price in that trial. Bars are standard error bars, clustered by subject.
Figure 5
Figure 5
Reaction times conditional on choice. (A) Reaction times as a function of the net value, conditional on purchasing the product. (B) Reaction times as a function of the net value, conditional on not purchasing the product. Black bars indicate data from the odd-numbered trials of the subject data, and the red dashed lines indicate the simulated data from the aDDM. Bars are standard error bars, clustered by subject.
Figure 6
Figure 6
Fixation properties. (A) The duration of middle item fixations as a function of the item value, (B) price, and (C) net value. (D) The duration of middle price fixations as a function of the product value, (E) price, and (F) net value. Bars are standard error bars, clustered by subject.
Figure 7
Figure 7
Item vs. price fixations. (A) Fixation duration as a function of fixation type: first fixation to item, first fixation to price, middle fixation to item, middle fixation to price, last fixation to item, and last fixation to price. Note that “first/last fixation” means the first/last fixation of the trial, not the first/last fixation to each stimulus. (B) Density plot of the total trial time spent looking at the item (blue) and price (black). (C) The number of item and price fixations in a trial, as a function of the magnitude of the net value. Bars are standard error bars, clustered by subject.
Figure A1
Figure A1
Histogram of the bids for the various products in the BDM task, using all the data.
Figure A2
Figure A2
Replication of all the figures from the text but including the $0 products.
Figure A2
Figure A2
Replication of all the figures from the text but including the $0 products.
Figure A2
Figure A2
Replication of all the figures from the text but including the $0 products.
Figure A3
Figure A3
Replication of Figures 2A,B choice and reaction time curves but using all of the data, including the $0 bids and net values beyond +/−$20.
Figure A4
Figure A4
Replication of Figures 3A,B, and 4A but using both the even and odd-numbered trials.

Similar articles

Cited by

References

    1. Armel K. C., Beaumel A., Rangel A. (2008). Biasing simple choices by manipulating relative visual attention. Judgm. Decis. Mak. 3, 396–403
    1. Baddeley A. (2003). Working memory: looking back and looking forward. Nat. Rev. Neurosci. 4, 829–83910.1038/nrm1251 - DOI - PubMed
    1. Basten U., Biele G., Heekeren H., Fieback C. J. (2010). How the brain integrates costs and benefits during decision making. Proc. Natl. Acad. Sci. U.S.A. 107, 21767–2177210.1073/pnas.0908104107 - DOI - PMC - PubMed
    1. Becker G. M., Degroot M. H., Marschak J. (1964). Measuring utility by a single-response sequential method. Behav. Sci. 9, 226–23210.1002/bs.3830090304 - DOI - PubMed
    1. Bogacz R. (2007). Optimal decision-making theories: linking neurobiology with behaviour. Trends Cogn. Sci. (Regul. Ed.) 11, 118–12510.1016/j.tics.2006.12.006 - DOI - PubMed

LinkOut - more resources