. 2012 Jan 1;8(24):2608-2619.
doi: 10.1039/C2SM00047D. Epub 2012 May 17.

Incorporation of DOPE into Lipoplexes formed from a Ferrocenyl Lipid leads to Inverse Hexagonal Nanostructures that allow Redox-Based Control of Transfection in High Serum

Affiliations

Incorporation of DOPE into Lipoplexes formed from a Ferrocenyl Lipid leads to Inverse Hexagonal Nanostructures that allow Redox-Based Control of Transfection in High Serum

John P E Muller et al. Soft Matter. .

Abstract

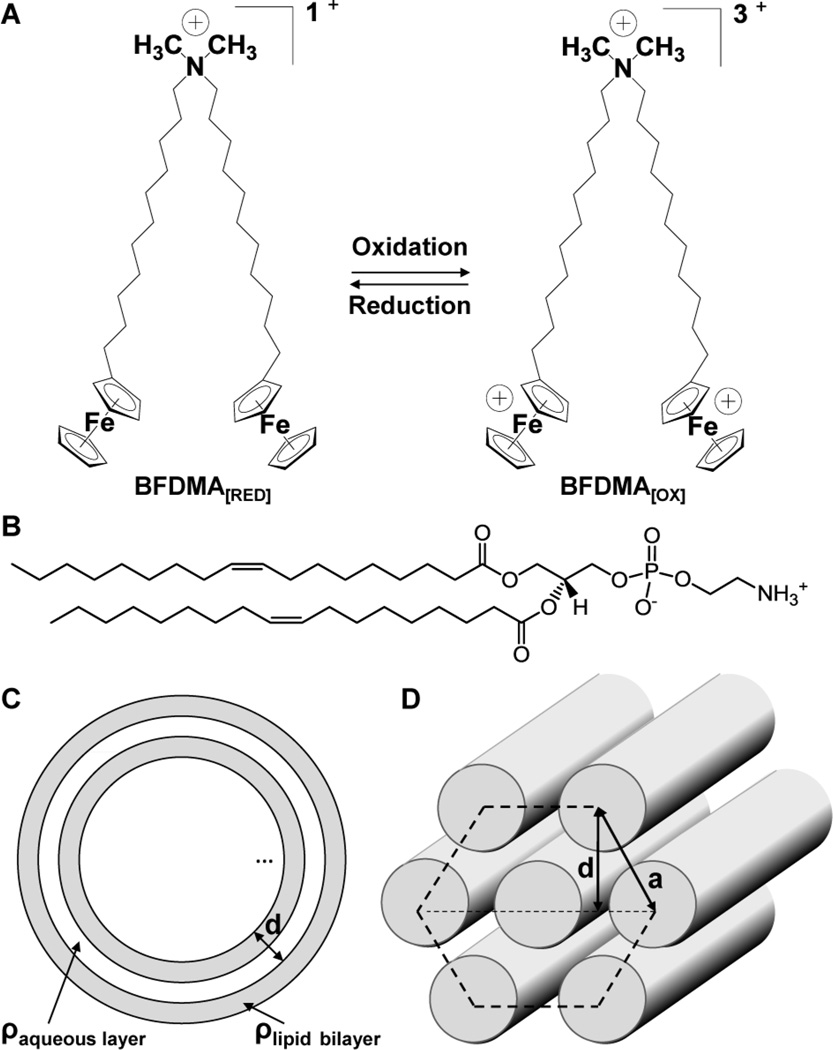
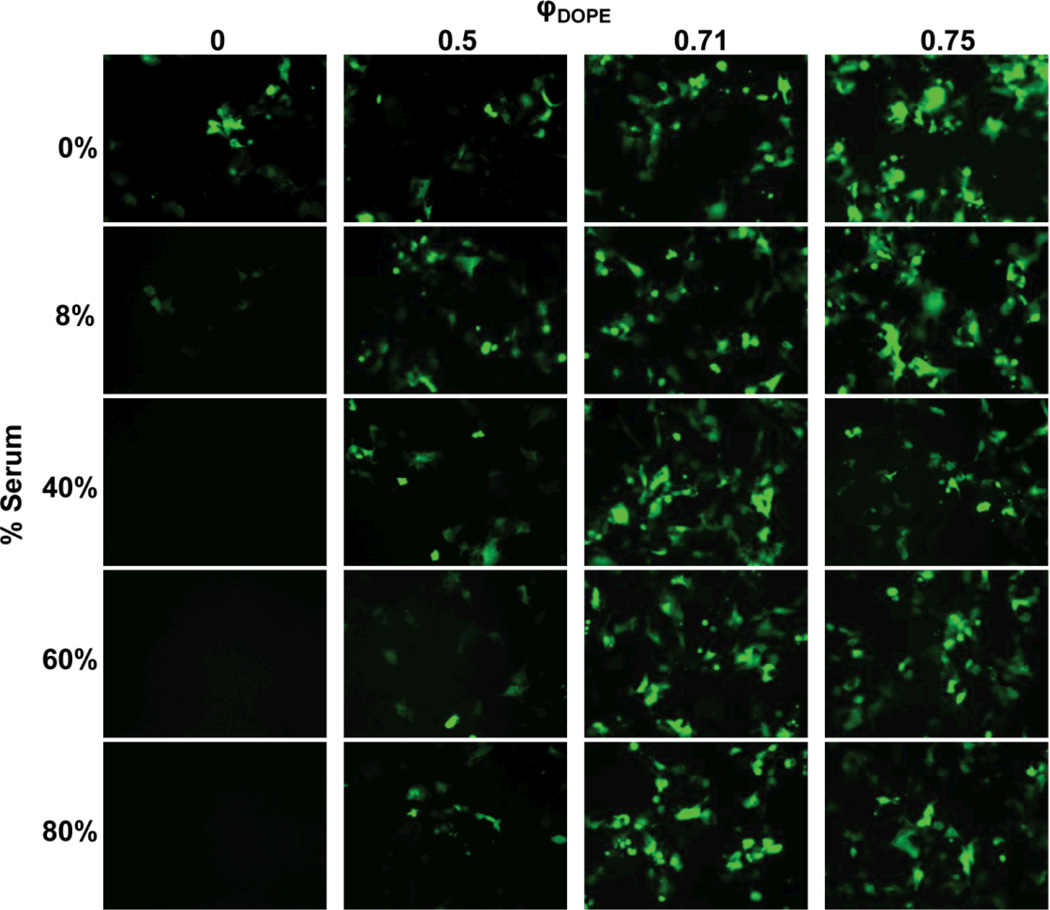
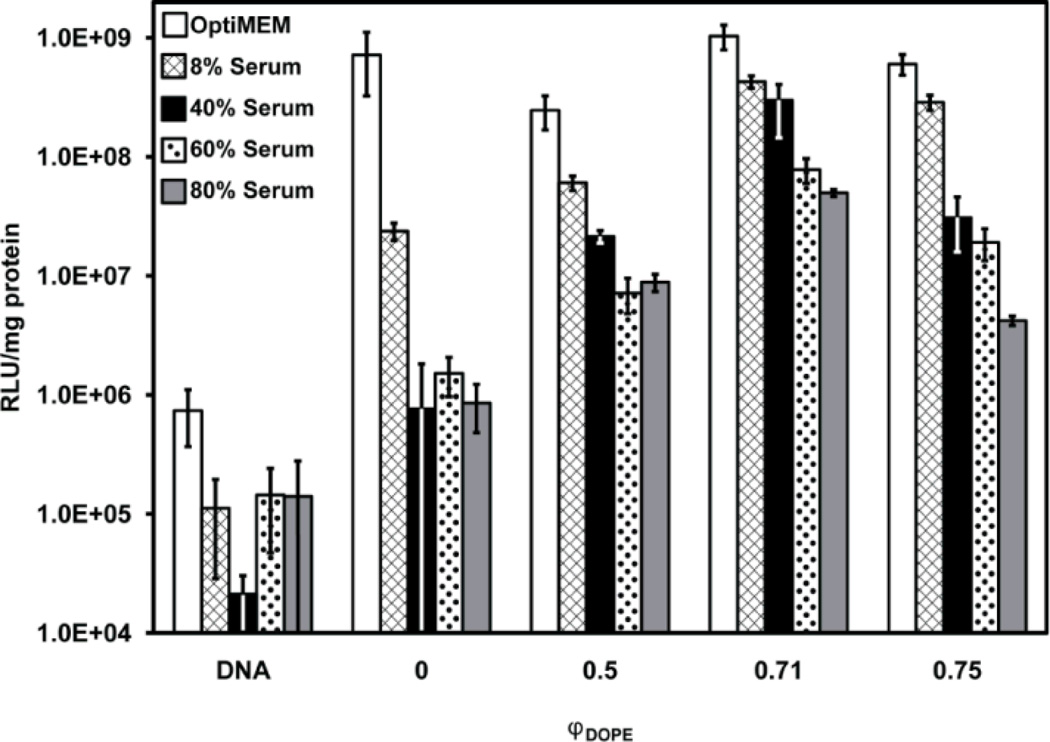
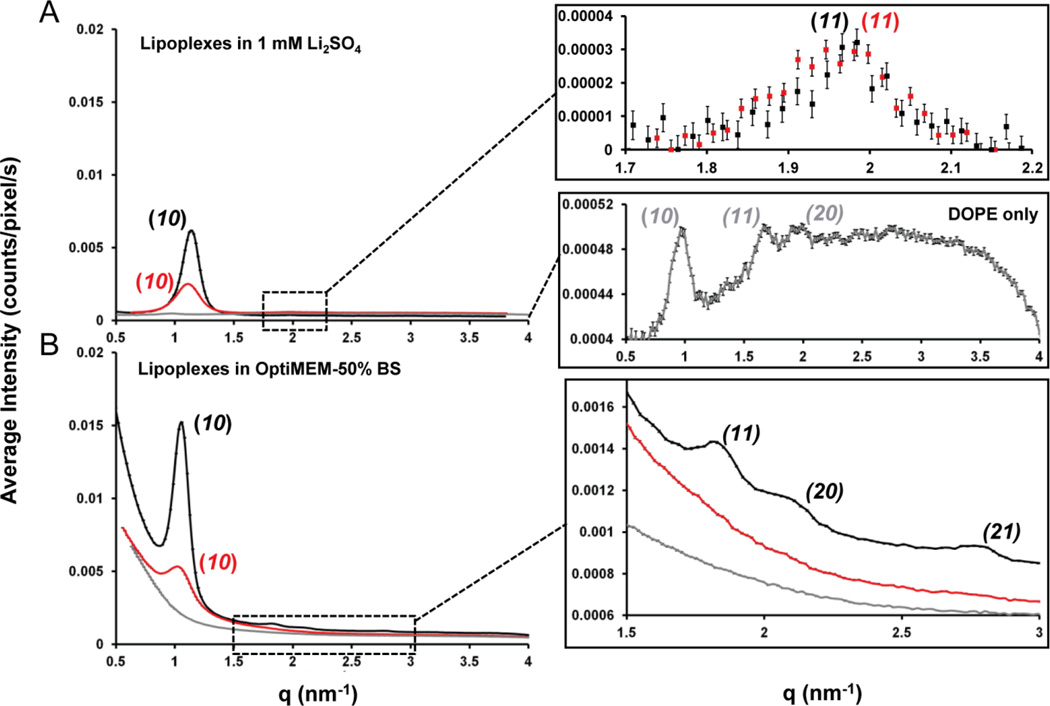
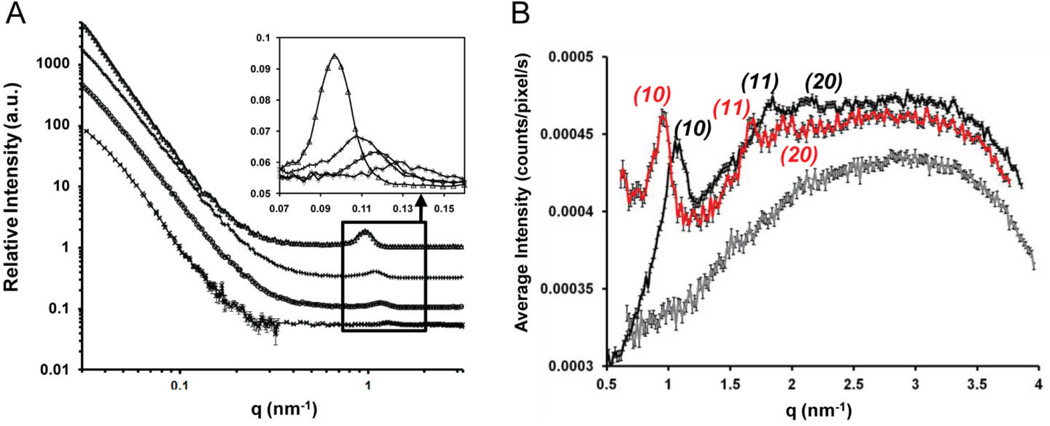
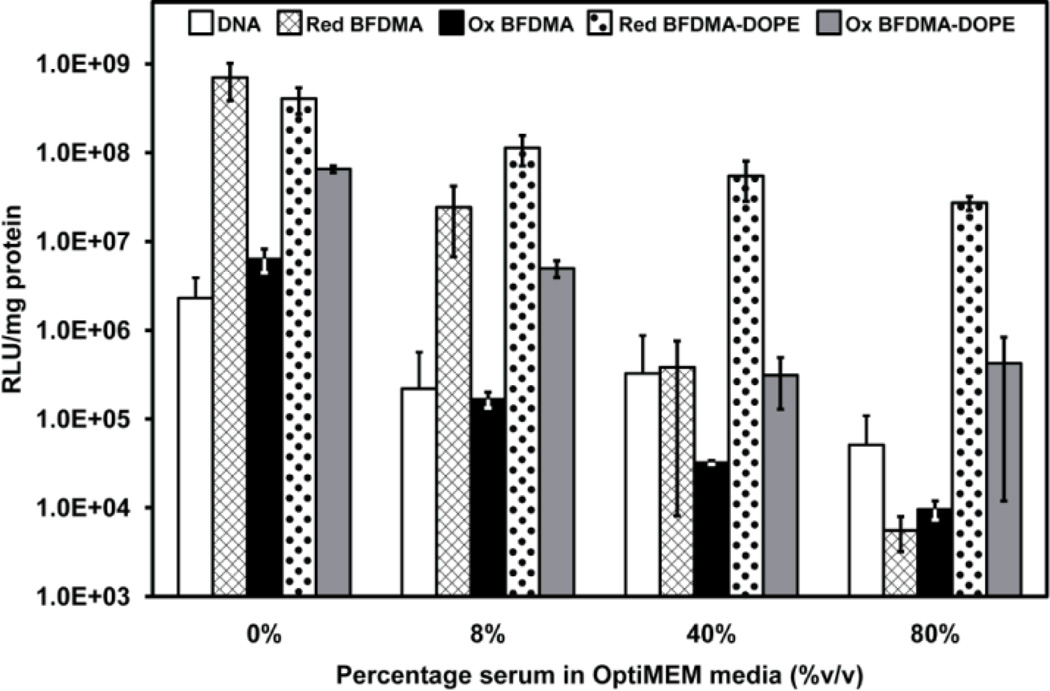
We report small angle X-ray and neutron scattering measurements that reveal that mixtures of the redox-active lipid bis(11-ferrocenylundecyl)dimethylammonium bromide (BFDMA) and dioleoylphosphatidylethanolamine (DOPE) spontaneously form lipoplexes with DNA that exhibit inverse hexagonal nanostructure (H(II) (c)). In contrast to lipoplexes of DNA and BFDMA only, which exhibit a multilamellar nanostructure (L(α) (c)) and limited ability to transfect cells in the presence of serum proteins, we measured lipoplexes of BFDMA and DOPE with the H(II) (c) nanostructure to survive incubation in serum and to expand significantly the range of media compositions (e.g., up to 80% serum) over which BFDMA can be used to transfect cells with high efficiency. Importantly, we also measured the oxidation state of the ferrocene within the BFDMA/DNA lipoplexes to have a substantial influence on the transfection efficiency of the lipoplexes in media containing serum. Specifically, whereas lipoplexes of reduced BFDMA and DOPE transfect cells with high efficiency, lipoplexes of oxidized BFDMA and DNA lead to low levels of transfection. Complementary measurements using SAXS reveal that the low transfection efficiency of the lipoplexes of oxidized BFDMA and DOPE correlates with the presence of weak Bragg peaks and thus low levels of H(II) (c) nanostructure in solution. Overall, these results provide support for our hypothesis that DOPE-induced formation of the H(II) (c) nanostructure of the BFDMA-containing lipoplexes underlies the high cell transfection efficiency measured in the presence of serum, and that the oxidation state of BFDMA within lipoplexes with DOPE substantially regulates the formation of the H(II) (c) nanostructure and thus the ability of the lipoplexes to transfect cells with DNA. More generally, the results presented in this paper suggest that lipoplexes formed from BFDMA and DOPE may offer the basis of approaches that permit active and external control of transfection of cells in the presence of high (physiologically relevant) levels of serum.


Figures

Fig. 1
Fig. 1
(A) Structure of BFDMA, a redox-active cationic lipid. The charge of BFDMA can be cycled between +1 (reduced) and +3 (oxidized) by oxidation or reduction of the ferrocenyl groups at the end of each hydrophobic tail; (B) Structure of DOPE; (C) Schematic illustration of a multilamellar vesicle nanostructure; (D) Schematic illustration of a hexagonal nanostructure.
Fig. 2
Fig. 2
Influence of serum on EGFP expression in COS-7 cells treated with lipoplexes formed from pEGFP-N1 and mixtures of reduced BFDMA and DOPE for 4 h. The media used was pure OptiMEM or a mixture of OptiMEM and BS. All experiments were performed by adding 50 µL of lipid/DNA mixture in 1 mM Li2SO4 solution to 200 µL of media in the presence of cells. Final BS concentrations are given down the left hand side of the figure. The overall concentrations of BFDMA and DNA in each lipoplex solution were 8 µM and 2.4 µg/ml, respectively, providing a charge ratio of 1.1:1 (+/−) for all samples as DOPE has a net charge of zero. Mole fractions of DOPE, φDOPE = DOPE/(BFDMA+DOPE), are given across the top of the figure. Fluorescence micrographs (1194 µm by 895 µm) were acquired 48 h after exposure of cells to lipoplexes.
Fig. 3
Fig. 3
Influence of serum on normalized luciferase expression in COS-7 cells treated with lipoplexes formed from pCMV-Luc and mixtures of reduced BFDMA and DOPE for 4 h. The final concentration of BS is given in the legend. DNA was present at a concentration of 2.4 µg/ml for all samples. “DNA” denotes a control with DNA only (no lipid). Molar fractions of DOPE, φDOPE = DOPE/(BFDMA+DOPE), are given on the x-axis for each sample. The concentration of BFDMA in each sample was 8 µM. Luciferase expression was measured 48 h after exposure to lipoplexes. Error bars represent one standard deviation.
Fig. 4
Fig. 4
SAXS spectra obtained using BFDMARED−DOPE (φDOPE = 0.71) (black), BFDMAOX-DOPE (φDOPE = 0.71) (red) or DOPE only (grey) containing lipoplexes in; (A) 1 mM Li2SO4, using lipid concentrations of 0.87 mM BFDMA and/or 2.17 mM DOPE; (B) OptiMEM with 50% (v/v) BS, using diluted lipid concentrations of 0.32 mM BFDMA and/or 0.8 mM DOPE; all in the presence of pEGFP-N1 (2.0 mg/ml) at a charge ratio of 1.1:1 or 3.3:1 (+/−) for reduced or oxidized BFDMA containing solutions respectively. Inserts for both graphs are given on the right hand side. Bragg peaks are indicated on the graphs and color coded to their respective lipoplex.
Fig. 5
Fig. 5
Evidence of association of BFDMA and DOPE in solution in the presence and absence of DNA; (A) SANS spectra measured using solutions of; (Δ) 1 mM DOPE (φDOPE = 1); (+) 1 mM BFDMA and 1 mM DOPE (φDOPE = 0.5); (o) 1 mM BFDMA and 0.4 mM DOPE (φDOPE = 0.28), (x) 1 mM BFDMA (φDOPE = 0), all in the presence of DNA (2.9 mg/ml) and, when BFDMA is present, at a charge ratio of 1.1:1 (+/−). The data are offset for clarity. The insert shows an expanded view of the Bragg peaks and has no offset in intensity between samples. (B) SAXS spectra obtained using lipid only solutions of; 1 mM BFDMA (grey); 2.5 mM DOPE (red); 1 mM BFDMA, 2.5 mM DOPE (black); all in 1 mM Li2SO4 (grey).
Fig. 6
Fig. 6
Influence of serum on the normalized luciferase expression in COS-7 cells treated with naked DNA (white bars), and lipoplexes of reduced BFDMA (hashed bars), oxidized BFDMA (black bars), reduced BFDMA and DOPE (φDOPE = 0.71, dotted bars), and oxidized BFDMA and DOPE (φDOPE = 0.71, gray bars) for 4 h. All experiments were performed by adding 50 µL of DNA/lipid mixture in 1 mM Li2SO4 solution to 200 µL media in the presence of cells. The media was pure OptiMEM or a mixture of OptiMEM and BS. The final concentration of BS is indicated along the x-axis. DNA was present at a concentration of 2.4 µg/ml in the presence of cells for all samples. 8 µM BFDMA was present in each BFDMA containing sample. Luciferase expression was measured 48 h after exposure to lipoplexes. Error bars represent one standard deviation.

Similar articles

Cited by

References

    1. Patnaik S, Tripathi SK, Goyal R, Arora A, Mitra K, Villaverde A, Vazquez E, Shukla Y, Kumar P, Gupta KC. Soft Matter. 2011;7:6103–6112.
    1. Ziauddin J, Sabatini DM. Nature. 2001;411:107–110. - PubMed
    1. Bailey SN, Wu RZ, Sabatini DM. Drug Discovery Today. 2002;7:S113–S118. - PubMed
    1. Chang FH, Lee CH, Chen MT, Kuo CC, Chiang YL, Hang CY, Roffler S. Nucleic Acids Res. 2004;32:1–6. - PMC - PubMed
    1. Delehanty JB, Shaffer KM, Lin BC. Anal. Chem. 2004;76:7323–7328. - PubMed