

Erythropoietin mediates neurobehavioral recovery and neurovascular remodeling following traumatic brain injury in rats by increasing expression of vascular endothelial growth factor
- PMID: 22707988
- PMCID: PMC3374663
- DOI: 10.1007/s12975-011-0120-2
Erythropoietin mediates neurobehavioral recovery and neurovascular remodeling following traumatic brain injury in rats by increasing expression of vascular endothelial growth factor
Abstract
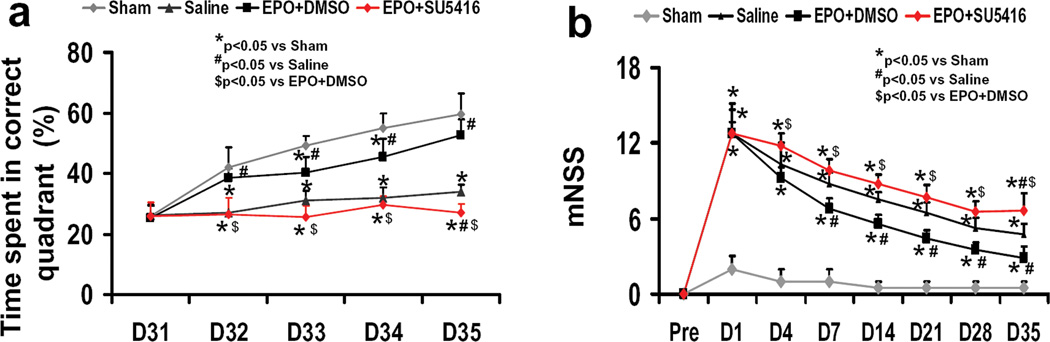
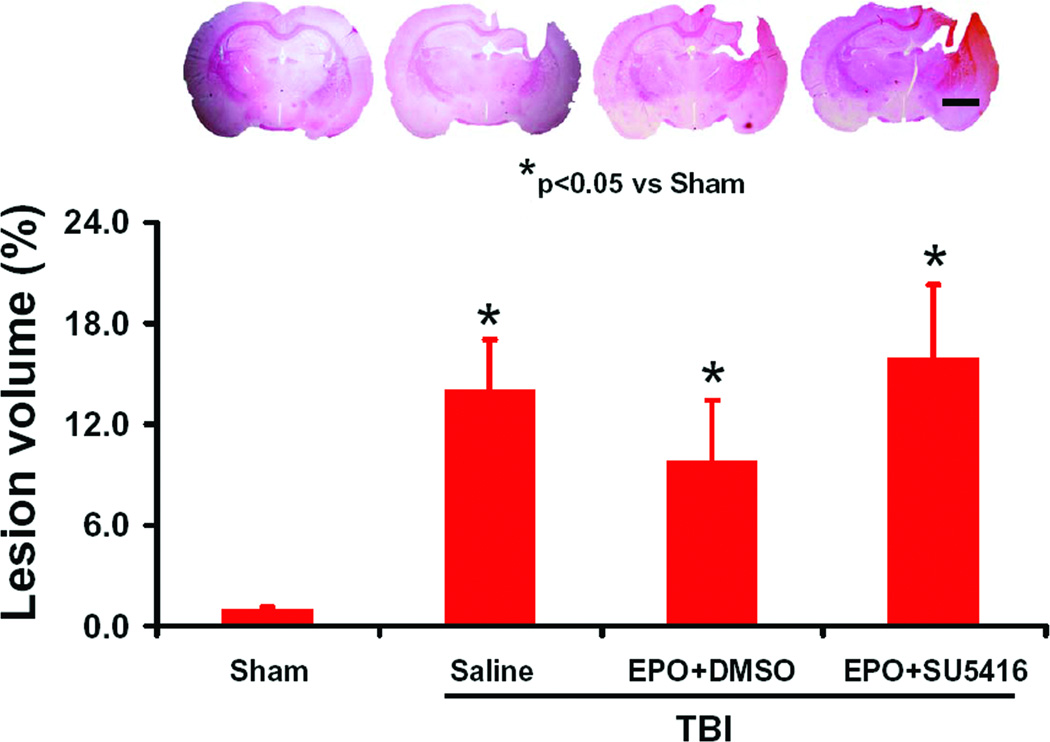
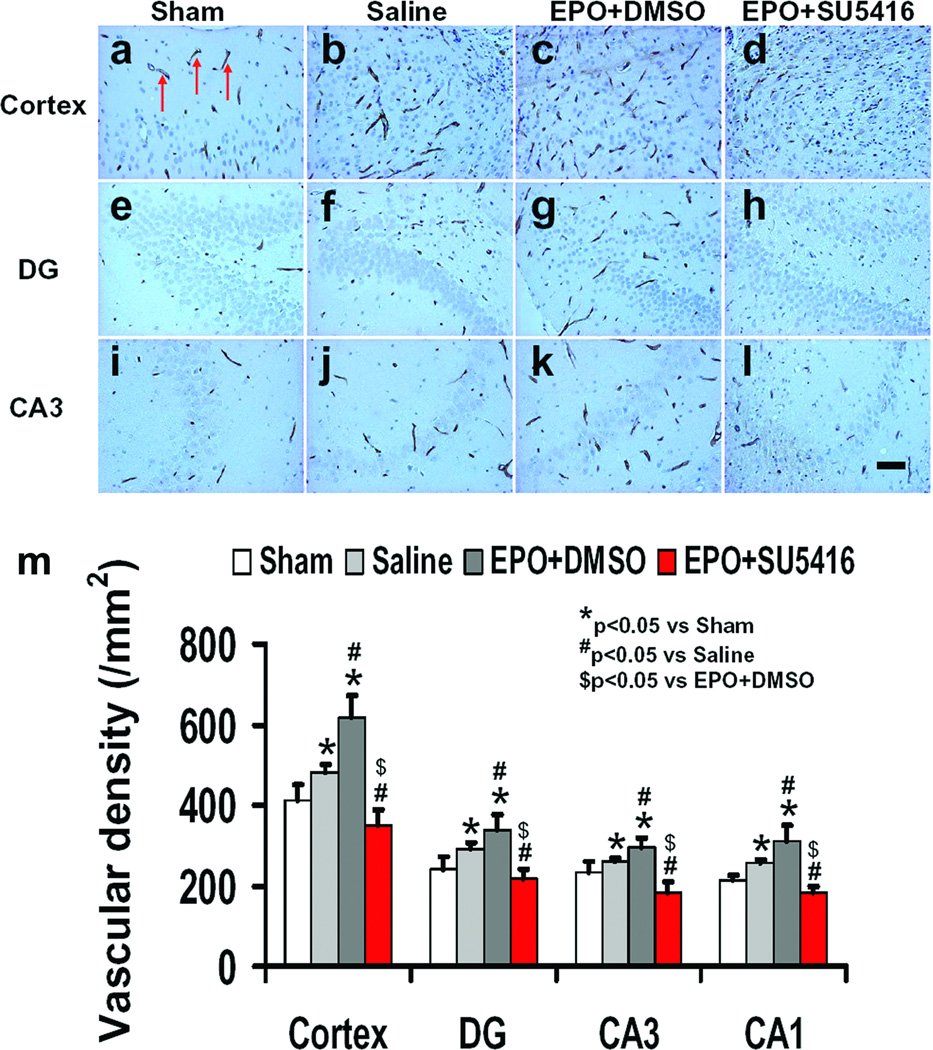
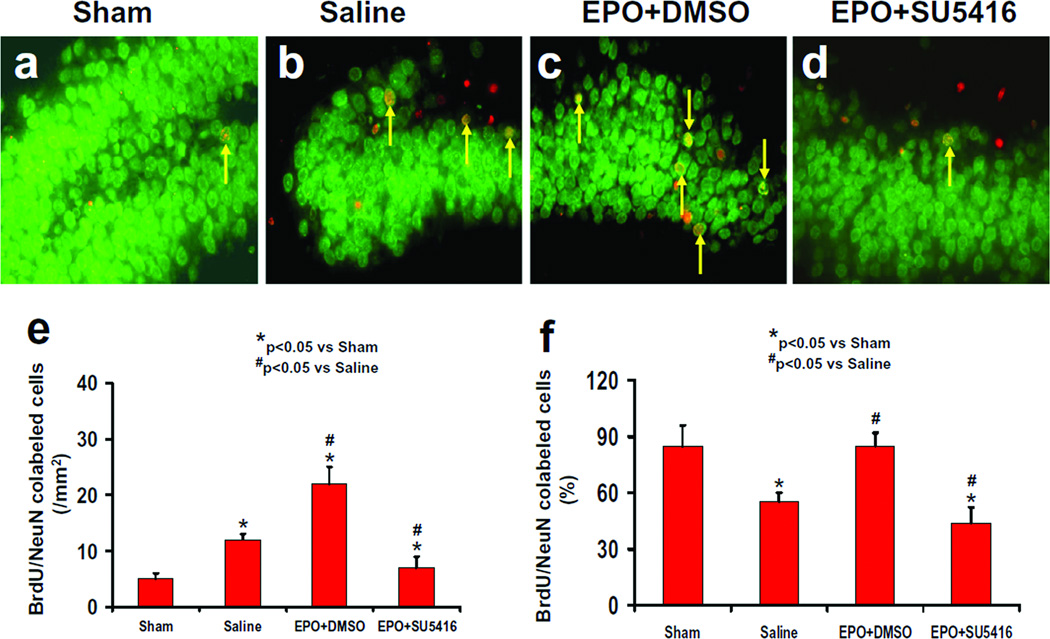
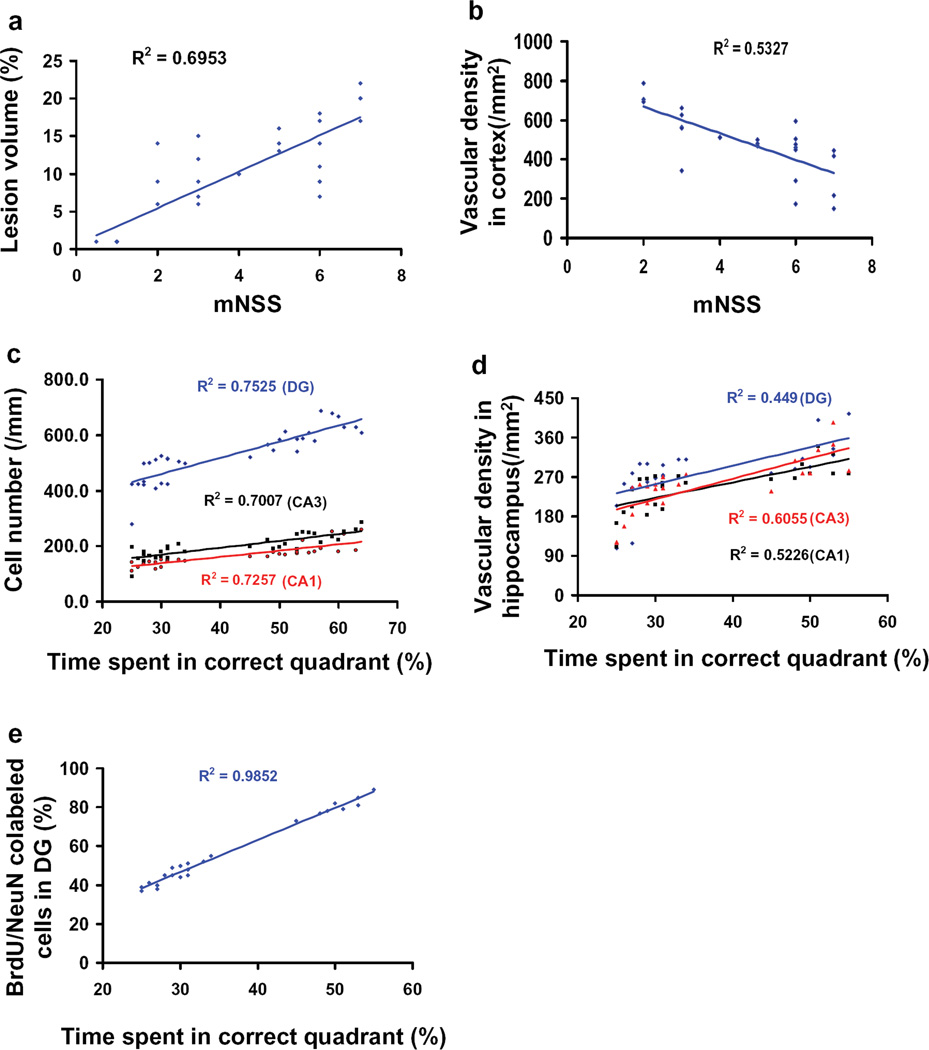
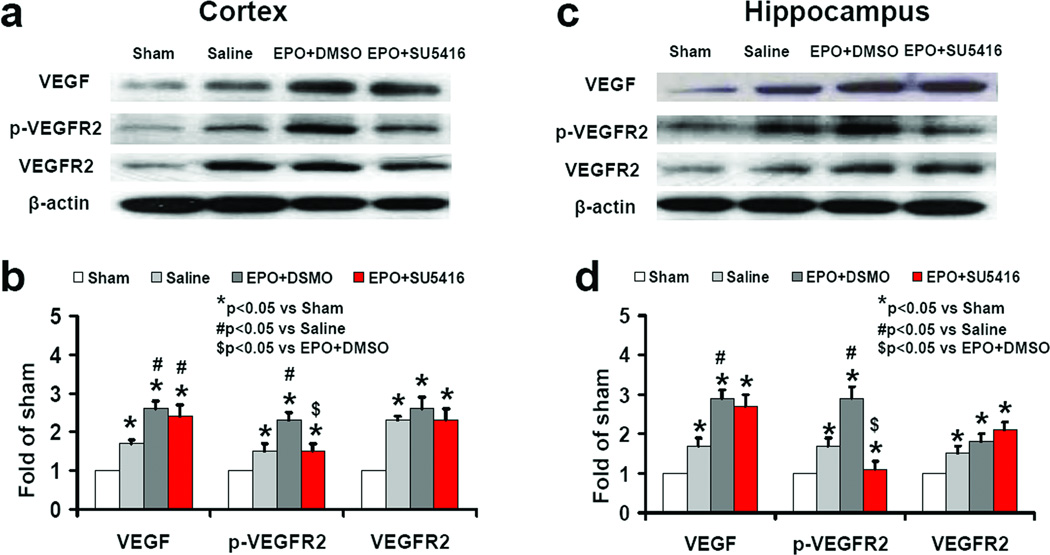
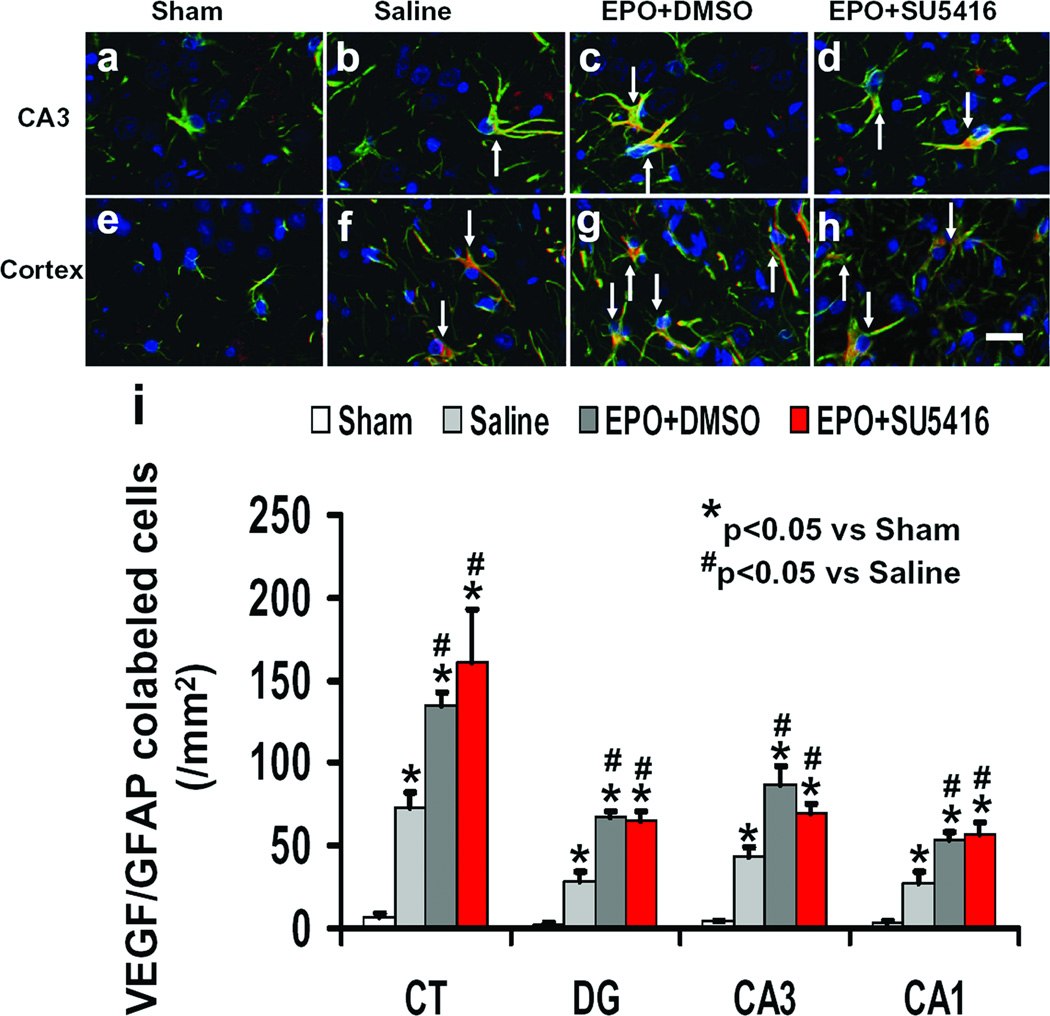
Erythropoietin (EPO) improves functional recovery after traumatic brain injury (TBI). Here, we investigated the role of vascular endothelial growth factor (VEGF) and VEGF receptor 2 (VEGFR2) on EPO-induced therapeutic efficacy in rats after TBI. Young male Wistar rats were subjected to unilateral controlled cortical impact injury and then infused intracerebroventricularly with either a potent selective VEGFR2 inhibitor SU5416 or vehicle dimethyl sulfoxide. Animals from both groups received delayed EPO treatment (5,000 U/kg in saline) administered intraperitoneally daily at 1, 2, and 3 days post injury. TBI rats treated with saline administered intraperitoneally daily at 1, 2, and 3 days post injury served as EPO treatment controls. 5-bromo-2-deoxyuridine was administered to label dividing cells. Spatial learning and sensorimotor function were assessed using a modified Morris water maze test and modified neurological severity score, respectively. Animals were sacrificed at 4 days post injury for measurement of VEGF and VEGFR2 or 35 days post injury for evaluation of cell proliferation, angiogenesis and neurogenesis. EPO treatment promoted sensorimotor and cognitive functional recovery after TBI. EPO treatment increased brain VEGF expression and phosphorylation of VEGFR2. EPO significantly increased cell proliferation, angiogenesis and neurogenesis in the dentate gyrus after TBI. Compared to the vehicle, SU5416 infusion significantly inhibited phosphorylation of VEGFR2, cell proliferation, angiogenesis, and neurogenesis as well as abolished functional recovery in EPO-treated TBI rats. These findings indicate the VEGF/VEGFR2 activation plays an important role in EPO-mediated neurobehavioral recovery and neurovascular remodeling after TBI.
Figures


Similar articles
-
Treatment of traumatic brain injury in rats with N-acetyl-seryl-aspartyl-lysyl-proline.J Neurosurg. 2017 Mar;126(3):782-795. doi: 10.3171/2016.3.JNS152699. Epub 2016 May 20. J Neurosurg. 2017. PMID: 28245754 Free PMC article.
-
Impact of inhibition of erythropoietin treatment-mediated neurogenesis in the dentate gyrus of the hippocampus on restoration of spatial learning after traumatic brain injury.Exp Neurol. 2012 May;235(1):336-44. doi: 10.1016/j.expneurol.2012.02.015. Epub 2012 Mar 4. Exp Neurol. 2012. PMID: 22414310 Free PMC article.
-
Erythropoietin promotes neurovascular remodeling and long-term functional recovery in rats following traumatic brain injury.Brain Res. 2011 Apr 12;1384:140-50. doi: 10.1016/j.brainres.2011.01.099. Epub 2011 Feb 3. Brain Res. 2011. PMID: 21295557 Free PMC article.
-
Therapeutic effects of erythropoietin on histological and functional outcomes following traumatic brain injury in rats are independent of hematocrit.Brain Res. 2009 Oct 19;1294:153-64. doi: 10.1016/j.brainres.2009.07.077. Epub 2009 Jul 30. Brain Res. 2009. PMID: 19646970 Free PMC article.
-
Effect of exosomes derived from multipluripotent mesenchymal stromal cells on functional recovery and neurovascular plasticity in rats after traumatic brain injury.J Neurosurg. 2015 Apr;122(4):856-67. doi: 10.3171/2014.11.JNS14770. Epub 2015 Jan 16. J Neurosurg. 2015. PMID: 25594326 Free PMC article.
Cited by
-
The Janus Face of VEGF in Stroke.Int J Mol Sci. 2018 May 4;19(5):1362. doi: 10.3390/ijms19051362. Int J Mol Sci. 2018. PMID: 29734653 Free PMC article. Review.
-
Current Therapies for Neonatal Hypoxic-Ischaemic and Infection-Sensitised Hypoxic-Ischaemic Brain Damage.Front Synaptic Neurosci. 2021 Aug 24;13:709301. doi: 10.3389/fnsyn.2021.709301. eCollection 2021. Front Synaptic Neurosci. 2021. PMID: 34504417 Free PMC article. Review.
-
Treatment of traumatic brain injury in rats with N-acetyl-seryl-aspartyl-lysyl-proline.J Neurosurg. 2017 Mar;126(3):782-795. doi: 10.3171/2016.3.JNS152699. Epub 2016 May 20. J Neurosurg. 2017. PMID: 28245754 Free PMC article.
-
A single intranasal dose of human mesenchymal stem cell-derived extracellular vesicles after traumatic brain injury eases neurogenesis decline, synapse loss, and BDNF-ERK-CREB signaling.Front Mol Neurosci. 2023 May 22;16:1185883. doi: 10.3389/fnmol.2023.1185883. eCollection 2023. Front Mol Neurosci. 2023. PMID: 37284464 Free PMC article.
-
Systemic administration of cell-free exosomes generated by human bone marrow derived mesenchymal stem cells cultured under 2D and 3D conditions improves functional recovery in rats after traumatic brain injury.Neurochem Int. 2017 Dec;111:69-81. doi: 10.1016/j.neuint.2016.08.003. Epub 2016 Aug 15. Neurochem Int. 2017. PMID: 27539657 Free PMC article.
References
-
- Davis AE. Mechanisms of traumatic brain injury: biomechanical, structural and cellular considerations. Crit Care Nurs Q. 2000;23(3):1–13. - PubMed
-
- Narayan RK, Michel ME, Ansell B, Baethmann A, Biegon A, Bracken MB, Bullock MR, Choi SC, Clifton GL, Contant CF, Coplin WM, Dietrich WD, Ghajar J, Grady SM, Grossman RG, Hall ED, Heetderks W, Hovda DA, Jallo J, Katz RL, Knoller N, Kochanek PM, Maas AI, Majde J, Marion DW, Marmarou A, Marshall LF, McIntosh TK, Miller E, Mohberg N, Muizelaar JP, Pitts LH, Quinn P, Riesenfeld G, Robertson CS, Strauss KI, Teasdale G, Temkin N, Tuma R, Wade C, Walker MD, Weinrich M, Whyte J, Wilberger J, Young AB, Yurkewicz L. Clinical trials in head injury. J Neurotrauma. 2002;19(5):503–557. - PMC - PubMed
-
- Royo NC, Schouten JW, Fulp CT, Shimizu S, Marklund N, Graham DI, McIntosh TK. From cell death to neuronal regeneration: building a new brain after traumatic brain injury. J Neuropathol Exp Neurol. 2003;62(8):801–811. - PubMed
Grants and funding
LinkOut - more resources
Full Text Sources
Other Literature Sources
Research Materials
