

Sex differences in how a low sensitivity to alcohol relates to later heavy drinking
- PMID: 22708705
- PMCID: PMC3459074
- DOI: 10.1111/j.1465-3362.2012.00469.x
Sex differences in how a low sensitivity to alcohol relates to later heavy drinking
Abstract
Introduction and aims: A low level of response (LR), or low sensitivity, to alcohol is a genetically influenced characteristic that predicts future heavy drinking and alcohol problems. While previous analyses of how LR relates to heavier drinking reported the process is similar in males and females, some potential sex differences have been identified. This difference is further explored in these analyses.
Design and methods: Prospective structural equation models (SEMs) were evaluated for 183 young adult females and 162 males, none of Asian background, from the Collaborative Study on the Genetics of Alcoholism. Invariance analyses and SEM evaluations by sex were used to compare across females and males for these primarily Caucasian (75%), non-Asian young (mean age 19) subjects.
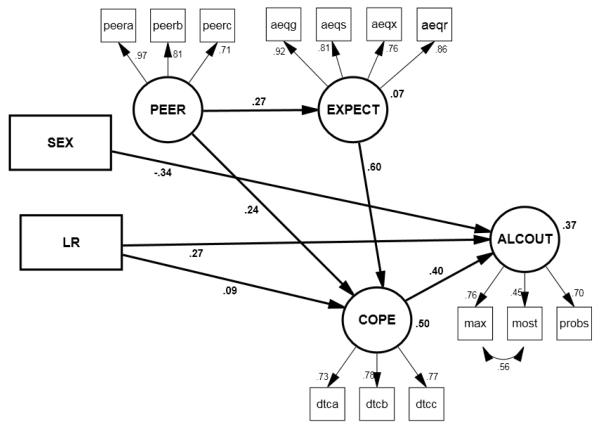
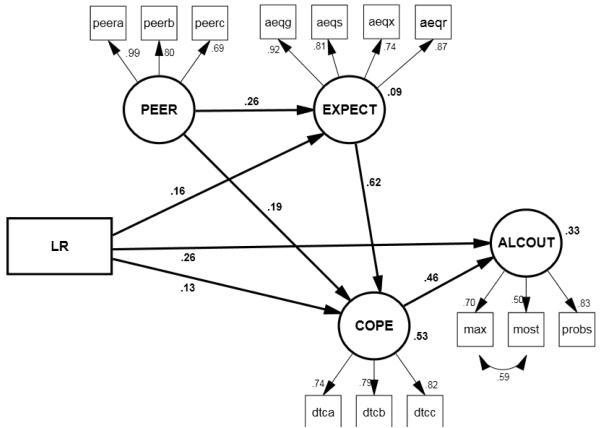
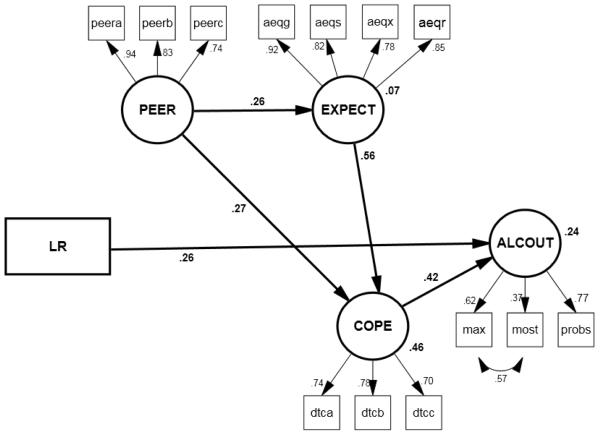
Results: The prospective SEM for the full set of 345 subjects had good fit characteristics and explained 37% of the variance. While the initial invariance analyses identified few sex differences, comparisons of correlations and direct evaluations of path coefficients across males and females indicated that only females showed a link between a low LR and future alcohol problems that was partially mediated by more positive alcohol expectancies and drinking to cope. These sex differences were reflected in the different structures of the SEM results for female versus male subjects.
Discussion and conclusions: These prospective results indicate that there might be some important sex differences regarding how a lower LR relates to alcohol outcomes that should be considered in protocols focusing on preventing the impact of LR on future drinking problems.
© 2012 Australasian Professional Society on Alcohol and other Drugs.
Figures
References
-
- Kelly AB, Toumbourou JW, O’Flaherty M, et al. Family relationship quality and early alcohol use: evidence for sex-specific risk processes. J Stud Alcohol Drugs. 2011;72:399–407. - PubMed
-
- Sher KJ, Grekin ER, Williams NA. The development of alcohol use disorders. Annu Rev Clin Psychol. 2005;1:493–523. - PubMed
-
- Slutske WS, Heath AC, Madden PA, Bucholz KK, Statham DJ, Martin NG. Personality and the genetic risk for alcohol dependence. J Abnorm Psychol. 2002;111:124–33. - PubMed
Publication types
MeSH terms
Substances
Grants and funding
LinkOut - more resources
Full Text Sources
Other Literature Sources
Medical
