. 2012 Jun 18:9:130.
doi: 10.1186/1742-2094-9-130.

Chronic ethanol increases systemic TLR3 agonist-induced neuroinflammation and neurodegeneration

Affiliations

Chronic ethanol increases systemic TLR3 agonist-induced neuroinflammation and neurodegeneration

Liya Qin et al. J Neuroinflammation. .

Abstract

Background: Increasing evidence links systemic inflammation to neuroinflammation and neurodegeneration. We previously found that systemic endotoxin, a TLR4 agonist or TNFα, increased blood TNFα that entered the brain activating microglia and persistent neuroinflammation. Further, we found that models of ethanol binge drinking sensitized blood and brain proinflammatory responses. We hypothesized that blood cytokines contribute to the magnitude of neuroinflammation and that ethanol primes proinflammatory responses. Here, we investigate the effects of chronic ethanol on neuroinflammation and neurodegeneration triggered by toll-like receptor 3 (TLR3) agonist poly I:C.

Methods: Polyinosine-polycytidylic acid (poly I:C) was used to induce inflammatory responses when sensitized with D-galactosamine (D-GalN). Male C57BL/6 mice were treated with water or ethanol (5 g/kg/day, i.g., 10 days) or poly I:C (250 μg/kg, i.p.) alone or sequentially 24 hours after ethanol exposure. Cytokines, chemokines, microglial morphology, NADPH oxidase (NOX), reactive oxygen species (ROS), high-mobility group box 1 (HMGB1), TLR3 and cell death markers were examined using real-time PCR, ELISA, immunohistochemistry and hydroethidine histochemistry.

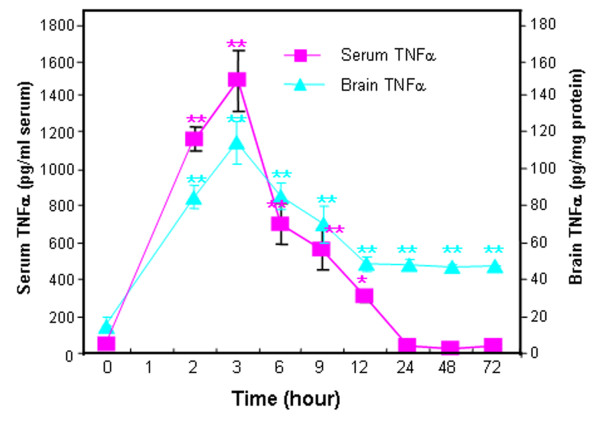
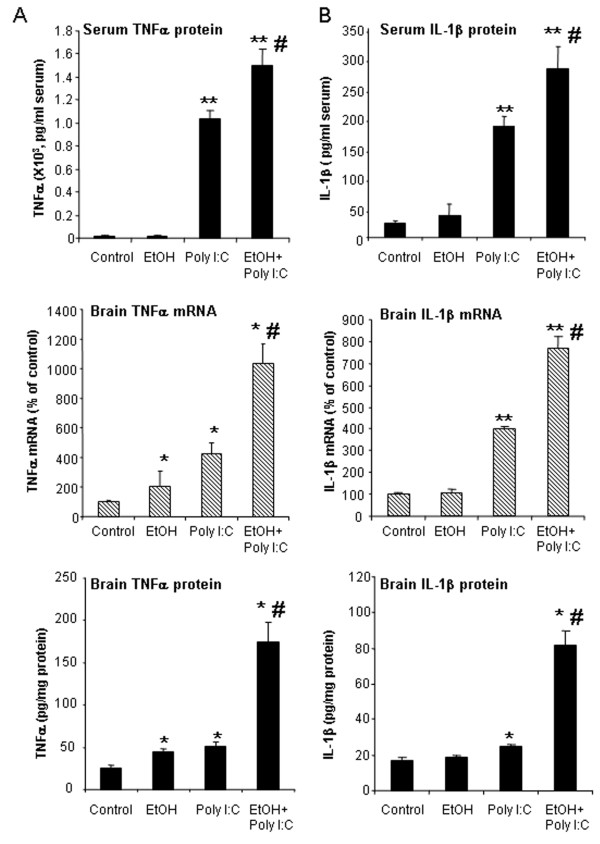
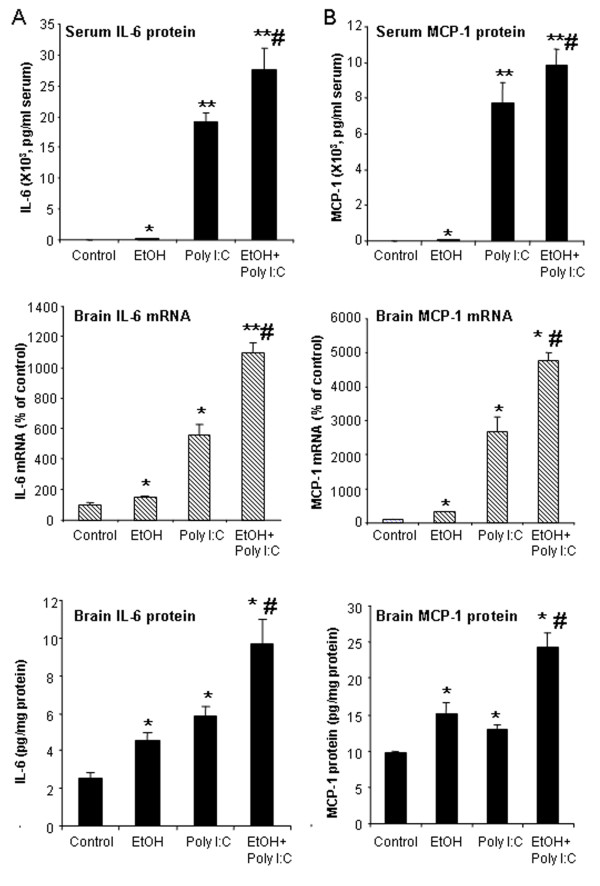
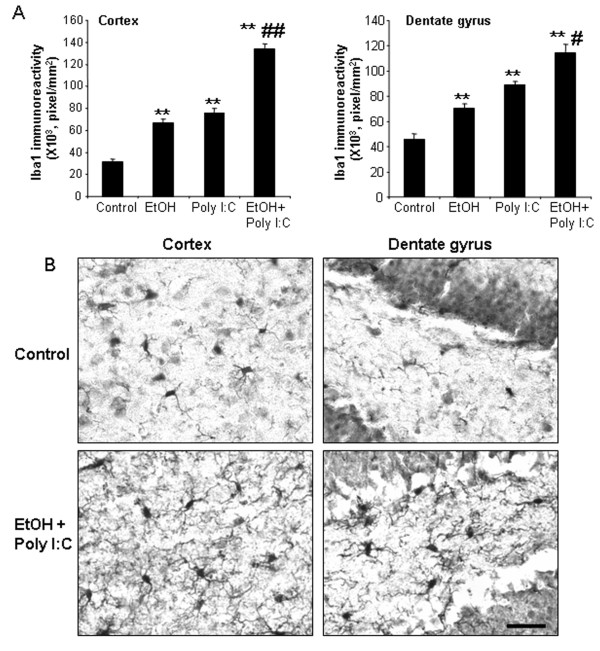
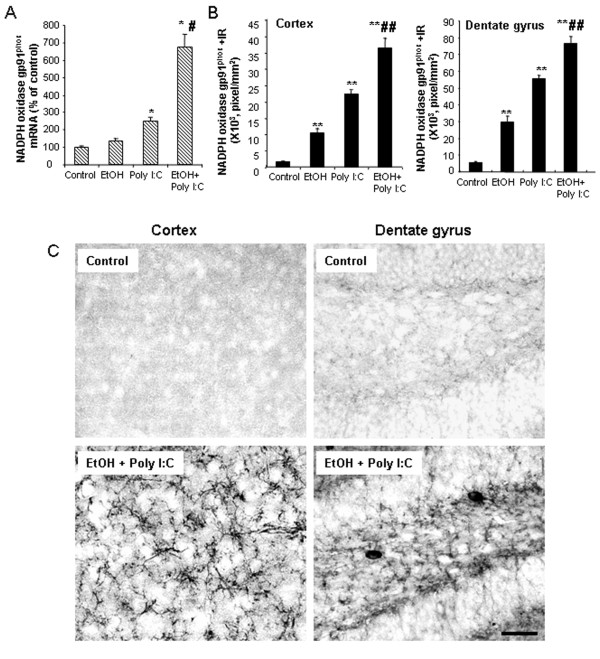
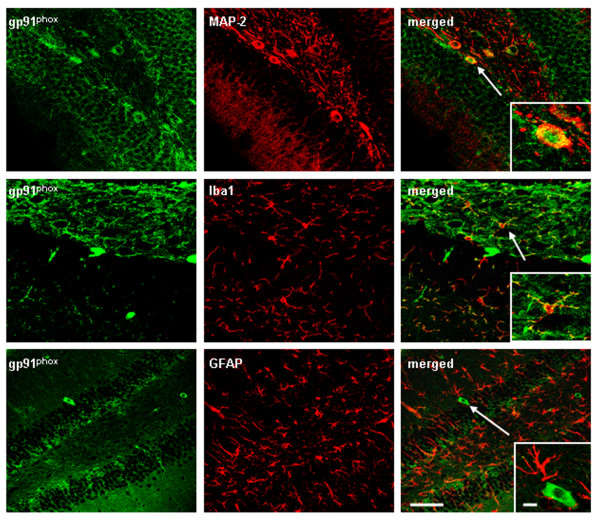
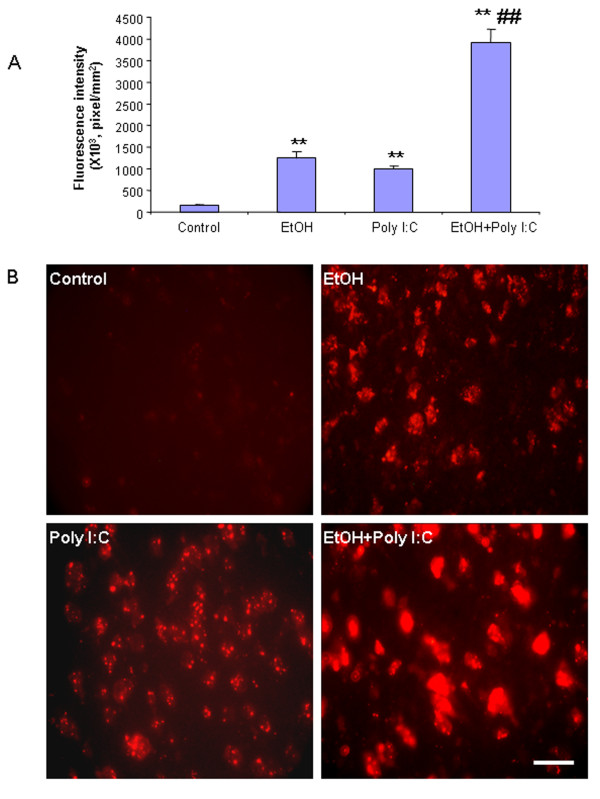
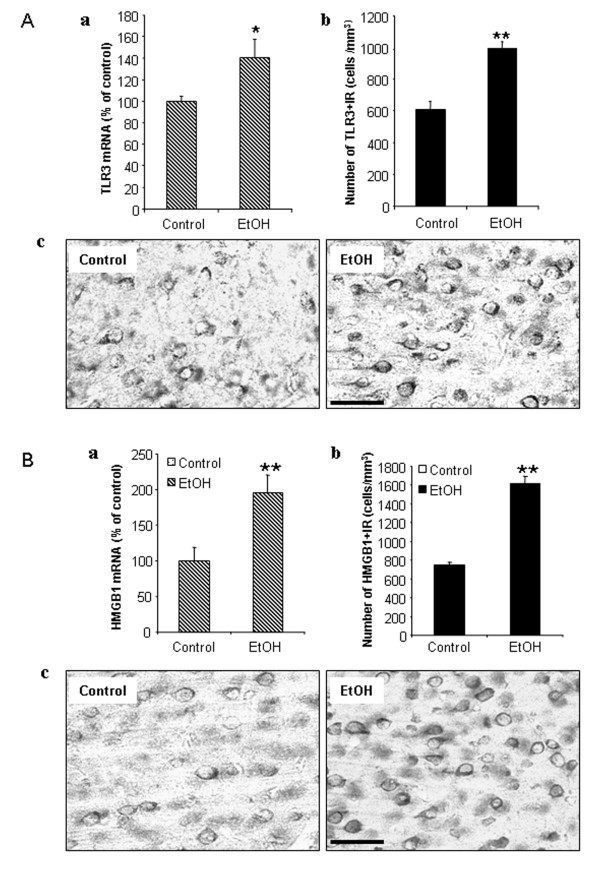
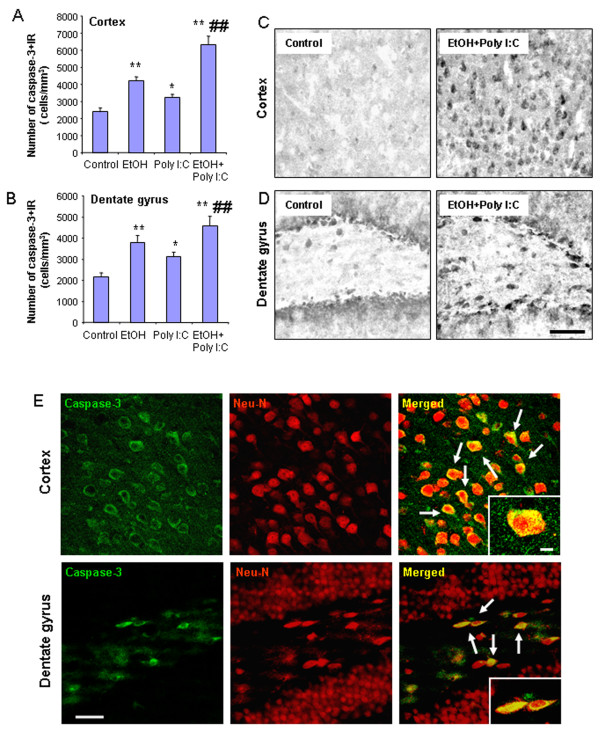
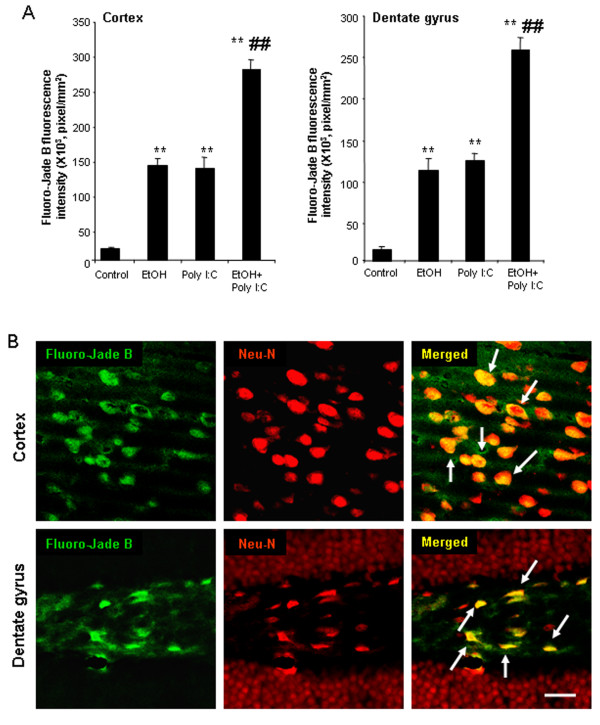
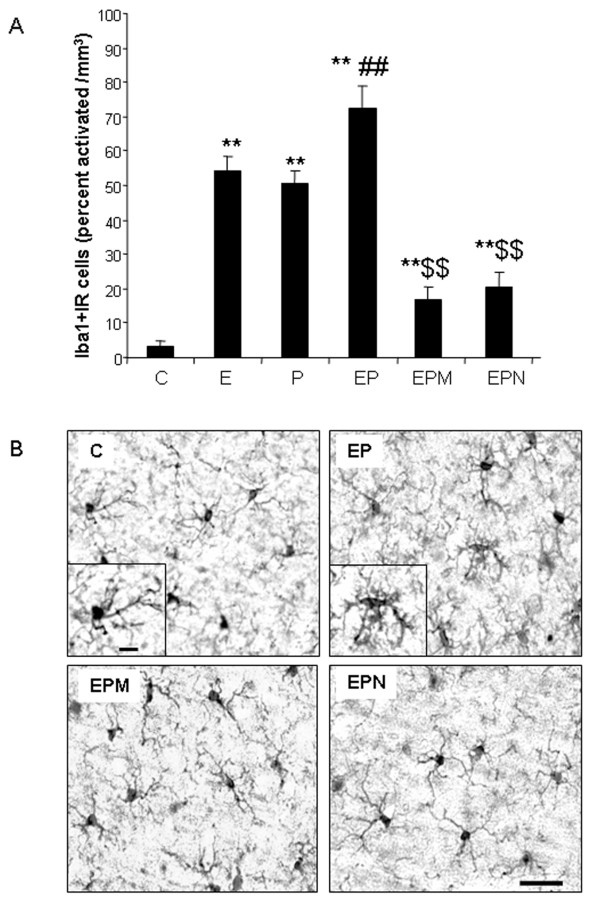
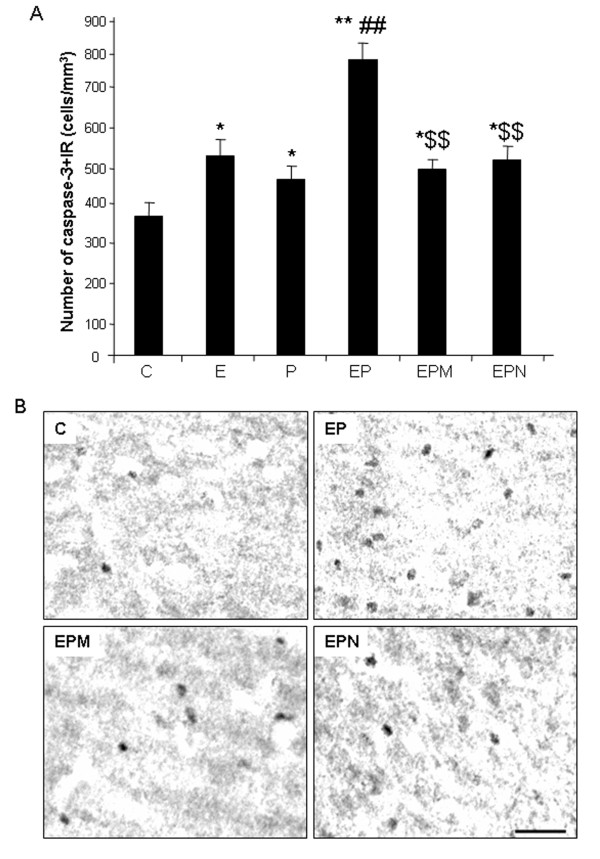
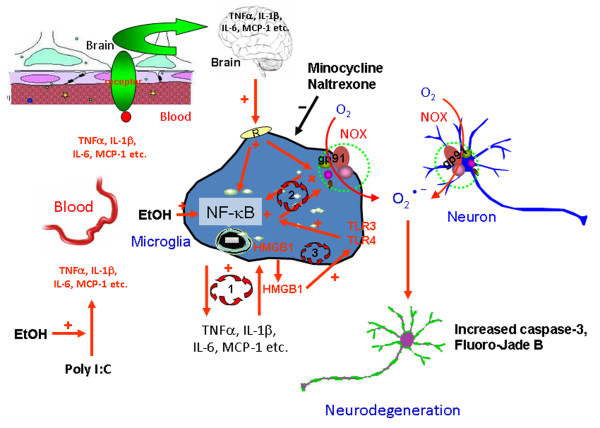
Results: Poly I:C increased blood and brain TNFα that peaked at three hours. Blood levels returned within one day, whereas brain levels remained elevated for at least three days. Escalating blood and brain proinflammatory responses were found with ethanol, poly I:C, and ethanol-poly I:C treatment. Ethanol pretreatment potentiated poly I:C-induced brain TNFα (345%), IL-1β (331%), IL-6 (255%), and MCP-1(190%). Increased levels of brain cytokines coincided with increased microglial activation, NOX gp91phox, superoxide and markers of neurodegeneration (activated caspase-3 and Fluoro-Jade B). Ethanol potentiation of poly I:C was associated with ethanol-increased expression of TLR3 and endogenous agonist HMGB1 in the brain. Minocycline and naltrexone blocked microglial activation and neurodegeneration.

Conclusions: Chronic ethanol potentiates poly I:C blood and brain proinflammatory responses. Poly I:C neuroinflammation persists after systemic responses subside. Increases in blood TNFα, IL-1β, IL-6, and MCP-1 parallel brain responses consistent with blood cytokines contributing to the magnitude of neuroinflammation. Ethanol potentiation of TLR3 agonist responses is consistent with priming microglia-monocytes and increased NOX, ROS, HMGB1-TLR3 and markers of neurodegeneration. These studies indicate that TLR3 agonists increase blood cytokines that contribute to neurodegeneration and that ethanol binge drinking potentiates these responses.


Figures

Figure 1
Figure 1
TLR3 agonist poly I:C induction of TNFα in mouse serum and brain. Levels of proinflammatory cytokine TNFα were determined following a single poly I:C (250 μg/kg, i.p.) and d-galactosamine (D-GalN, 20 mg/kg, i.p.) injection into C57BL/6 mice. At the time points indicated, mice were sacrificed and brain extracts and sera prepared as described in methods. Note both brain and serum TNFα peaked at three hours. Interestingly, blood (serum) TNFα declined to control level by 24 hours whereas brain TNFα level remained elevated at about half the peak level for at least 72 hours. The results shown are the means ± SEM of two experiments performed with seven mice per time point. *P <0.05, **P <0.01, compared to the corresponding vehicle controls.
Figure 2
Figure 2
Effect of chronic ethanol treatment on poly I:C-induced blood and brain TNFα and IL-1β. As described in the methods, male C57BL/6 mice were treated intragastrically with ethanol (5 g/kg, i.g. daily for 10 days) and 24 hours after the last dose of ethanol treatment injected intraperitoneally with poly I:C (250 μg/kg) plus D-GalN (20 mg/kg). Brains were collected three hours after poly I:C injection for all groups, that is, ethanol alone is 27 hours after the last dose of ethanol. The levels of serum TNFα and IL-1β protein and brain TNFα and IL-1β mRNA and protein were measured by real-time PCR and ELISA. (A) Poly I:C treatment increased serum TNFα protein and brain TNFα mRNA and protein. Ethanol treatment did not alter serum TNFα protein, but increased brain TNFα mRNA and protein. Ethanol exposure potentiated poly I:C-induced serum TNFα protein as well as brain TNFα mRNA and protein. (B) Poly I:C treatment increased serum IL-1β protein and brain IL-1β mRNA and protein. Ethanol alone had no significant effect. Ethanol pretreatment potentiated poly I:C-induced serum IL-1β protein and brain IL-1β gene expression and protein synthesis. The results are the means ± SEM in two independent experiments with seven animals per group. *P <0.05, **P <0.01, compared with the vehicle control group. #P <0.05, compared with the corresponding poly I:C treated group.
Figure 3
Figure 3
Effect of chronic ethanol treatment on poly I:C-induced blood and brain IL-6 and MCP-1. As described in the methods, male C57BL/6 mice were treated intragastrically with ethanol (5 g/kg, i.g. daily for 10 days) and 24 hours after the last dose of ethanol treatment injected intraperitoneally with poly I:C (250 μg/kg) plus D-GalN (20 mg/kg). Brains were collected three hours after poly I:C injection for all groups, that is, ethanol alone is 27 hours after the last dose of ethanol. (A) Ethanol or poly I:C alone treatment increased serum IL-6 protein and brain IL-6 mRNA and protein. Sequential ethanol-poly I:C treatment significantly augmented the blood and brain levels of IL-6. (B) Ethanol or poly I:C alone treatment increased serum MCP-1 protein and brain MCP-1 mRNA and protein. Ethanol pretreatment potentiated poly I:C-induced serum MCP-1 protein and brain MCP-1 gene expression and protein synthesis. The results are the means ± SEM in two independent experiments with seven animals per group. *P <0.05, **P <0.01, compared with the vehicle control group. #P <0.05, compared with the corresponding poly I:C treated group.
Figure 4
Figure 4
Immunocytochemical analysis of microglia. Mice were treated as described above. (A) Levels of immunoreactive density of Iba1, a marker of microglia, in cortex and hippocampal dentate gyrus were quantified using BioQuant image analysis software and presented as mean ± SEM in pixel/mm2. Ethanol alone, poly I:C alone and ethanol-poly I:C treated groups all show increased Iba1 + IR in both brain regions. (B) Representative images of Iba1 + IR cells in cortex and dentate gyrus from control and ethanol-poly I:C-treated groups. In water control group, microglia showed a resting morphological shape. In either ethanol or poly I:C alone-treated groups, some of the microglia are enlarged (images not shown). Iba1 + IR cells in EtOH-poly I:C-treated mouse brains have increased cell size, irregular shape, and intensified Iba1 staining consistent with morphological changes in activated microglia. Scale bar, 200 μm.
Figure 5
Figure 5
Induction of NOX-NADPH oxidase subunit gp91phoxexpression. Male C57BL/6 mice were treated with ethanol, poly I:C, ethanol-poly I:C as indicated in methods. (A) gp91phox gene expression was determined by real-time PCR three hours after poly I:C treatment. Note chronic ethanol pretreatment increased brain poly I:C-induced gp91phox mRNA by 2.7-fold. (B) NADPH oxidase subunit gp91phox + IR in cortex and dentate gyrus (DG). Sections were stained with monoclonal mouse gp91phox antibody and quantified by BioQuant image analysis system. NADPH oxidase subunit gp91phox + IR was increased in cortex about 6 fold by ethanol and 14 fold by poly I:C and in DG about 5 fold by ethanol and 10 fold by poly I:C. Pretreatment of ethanol significantly enhanced poly I:C-induced gp91phox + IR in both cortex and DG. (C) The images shown are representative of gp91phox + IR cells from cortex (left) and dentate gyrus (right) for control (upper images) and ethanol-poly I:C groups (lower images). *P <0.05, **P <0.01, compared with the vehicle control mice. #P <0.05, ##P <0.01, compared with poly I:C-treated mice. Scale bar, 200 μm.
Figure 6
Figure 6
Confocal microscopy with cell specific markers finds neuronal and microglial expression of NADPH oxidase subunit gp91phox. Brain sections from ethanol-poly I:C-treated mice were double-labeled for gp91phox in green with neuronal marker MAP-2, microglial marker Iba1, or astroglial marker GFAP in red. Co-labeling was investigated using a Leica SP2 LCS confocal microscope with associated software. The representative images shown are from dentate gyrus of mice treated with ethanol-poly I:C. The left panel of pictures shows gp91phox + IR. The middle panel shows cell specific markers, for example, neuronal MAP-2 (upper panel), microglial Iba1 (middle) and astrocyte GFAP (lower panel) pictures. Merged images are to the right. Merged yellow indicates red and green are combined and likely co-localized within the marked cell. Merged pictures on the right with enlarged cells suggest that gp91phox + IR is expressed in MAP-2 neurons (yellow) and Iba1 microglia (yellow), but not in astrocytes. Scale bar, 30 μm; inset 5 μm.
Figure 7
Figure 7
Superoxide formation and oxidative stress in brain. Mice were injected with hydroethidine (dihydroethidium, 10 mg/kg, i.p.) 2.5 hours after poly I:C treatment and brains harvested 30 minutes later, frozen and sectioned (15 μm thickness) as described in the methods. The oxidation product, ethidium, is formed from dihydroethidium by superoxide resulting in ethidium accumulation within cells producing superoxide. Ethidium is detected as red nuclei by fluorescence microscopy. The level of fluorescence intensity of ethidium-positive cells was quantified by BioQuant image analysis software. (A) Quantitation of ethidium fluorescence indicates ethanol, poly I:C and ethanol + poly I:C treatment significantly increases O2- and O2--derived oxidant production in cortex. (B) Representative images of ethidium fluorescence. Ethanol and poly I:C alone increased O2- and O2--derived oxidant production compared with vehicle control. Ethanol pretreatment significantly potentiated poly I:C-induced O2- and O2--derived oxidant production. **P <0.01, compared with vehicle control group. ##P <0.01 compared with poly I:C group. Scale bar, 200 μm.
Figure 8
Figure 8
Ethanol increases TLR3 and HMGB1 expression. Chronic ethanol treatment of C57BL/6 mice (5 g/kg, i.g., daily for 10 days) increased mRNA and protein expression (+IR) of brain TLR3 and HMGB1. (A) Quantitation of TLR3 mRNA and TLR3 + IR. (A-a) Level of brain TLR3 mRNA 27 hours following the last dose of ethanol treatment was measured using real-time PCR as described in the methods. Ethanol exposure significantly increased brain TLR3 mRNA. (A-b) TLR3 + IR cells were counted in mouse cortex after TLR3 immunostaining. Ethanol significantly increased the number of TLR3 + IR cells. (A-c) Representative images of immunohistochemical staining for TLR3 in the cortex of control and ethanol-treated mice. (B) Quantitation of HMGB1 mRNA and HMGB1 + IR. (B-a) HMGB1 mRNA was measured by real-time PCR in which ethanol increased by about 2 fold. (B-b) Quantitative evaluation of HMGB1 + IR. The number of HMGB1 + IR cells was increased about 2 fold. (B-c) The representative images of immunohistochemical staining for HMGB1 in the cortex of control and ethanol-treated mice. *P <0.05, **P <0.01, compared with water control group. Scale bar, 50 μm.
Figure 9
Figure 9
Activated caspase-3 + IR in brain. Brain sections were stained with polyclonal cleave caspase-3 (Asp175) antibody, a marker of cell death. (A) Quantitation of caspase-3 + IR in cortex. The number of caspase-3 + IR cells in cortex was increased by ethanol, poly I:C and sequential ethanol-poly I:C. (B) Quantitation of caspase-3 + IR in hippocampal dentate gyrus. The number of caspase-3 + IR cells in dentate gyrus was increased by ethanol, poly I:C and sequential ethanol-poly I:C. The results are the means ± SEM of two independent experiments performed with seven mice per group. *P <0.05, **P <0.01, compared with vehicle control. ##P <0.01, compared with poly I:C. (C and D) Representative images of caspase-3 + IR in cortex (C) and dentate gyrus (D) in vehicle control and ethanol-poly I:C groups. Scale bar, 200 μm. To determine if caspase-3 + IR was within neurons, brain sections were double-stained with NeuN (a neuronal marker). (E) Confocal microscopy images of cortex (upper panels) and dentate gyrus (lower panels) in ethanol-poly I:C group. Immunolabeling was visualized by using Alexa Fluor 488 and 555. Confocal microscopy indicates that caspase-3 + IR cells in green (left panels) are NeuN positive in red (middle panels), as shown in the merged images (right panels) with arrows indicating yellow co-labeling of caspase-3 and NeuN. Insets are higher magnification of the merged images. Scale bar, 30 μm; inset 5 μm.
Figure 10
Figure 10
Activated Fluoro-Jade B in brain. (A) Brain sections were stained with Fluoro-Jade B, a marker of cell death, and quantitated in cortex and dentate gyrus. The Fluoro-Jade B fluorescence in cortex and dentate gyrus was increased by ethanol, poly I:C and sequential ethanol-poly I:C. The results are the means ± SEM of two independent experiments performed with seven mice per group. **P <0.01, compared with vehicle control. ##P <0.01, compared with poly I:C. (B) Confocal microscopy images of cortex (upper panels) and dentate gyrus (lower panels) in ethanol-poly I:C group. Immunolabeling was visualized by using Alexa Fluor 488 and 555. Confocal microscopy indicates that Fluoro-Jade B in green (left panels) are NeuN positive in red (middle panels), as shown in the merged images (right panels) with arrows indicating yellow co-labeling. Scale bar, 30 μm.
Figure 11
Figure 11
Minocycline and naltrexone block microglial activation.(A) Quantification of activated Iba1 + IR cells in cortex. Ethanol, poly I:C and ethanol-poly I:C treatment groups show increased microglial activation. Minocycline and naltrexone decreased ethanol-poly I:C-activated Iba1 + IR cells. (C, control; E, ethanol; P, poly I:C; EP, ethanol-poly I:C; EPM, ethanol-poly I:C-minocycline; EPN, ethanol-poly I:C-naltrexone.). (B) Representative images from vehicle control (C), ethanol-poly I:C (EP), ethanol-poly I:C-minocycline (EPM) and ethanol-poly I:C-naltrexone (EPN) groups in cortex. In control, EPM and EPN groups, most microglia are in a resting state: small cell bodies with thin, highly ramified processes. In the EP-treated group, microglia are activated: large cell bodies, irregular shape and intensified Iba1 staining. **P <0.01, compared with control group. ##P <0.01, compared with poly I:C group. $$P <0.01, compared with ethanol-poly I:C group. Scale bar, 200 μm.
Figure 12
Figure 12
Minocycline and naltrexone blunt ethanol-poly I:C-induced caspase-3 + IR. (A) Brain sections were stained with polyclonal cleave caspase-3 (Asp175) antibody. Immunolabeling was visualized by using nickel-enhanced 3,3′-diaminobenzidinne (DAB) as described in the methods. The number of caspase-3 + IR cells in cortex was significantly increased in ethanol, poly I:C and ethanol-poly I:C treatment groups. Minocycline and naltrexone reduced ethanol-poly I:C-induced caspase-3 expression. (C, control; E, ethanol; P, poly I:C; EP, ethanol-poly I:C; EPM, ethanol-poly I:C-minocycline; EPN, ethanol-poly I:C-naltrexone). (B) Images are representative of vehicle control (C), ethanol-poly I:C (EP), ethanol-poly I:C-minocycline (EPM) and ethanol-poly I:C-naltrexone (EPN) groups in cortex. Scale bar, 50 μm. *P <0.05, **P <0.01, compared with vehicle control. ##P <0.01, compared with poly I:C. $$P <0.01, compared with ethanol-poly I:C.
Figure 13
Figure 13
Schematic summary and hypothetical mechanisms of neuroinflammation and neurodegeneration. (Lower left) Chronic ethanol treatment potentiates poly I:C increases serum TNFα IL-1β, IL-6 and MCP-1 protein. These proteins in the blood enter the brain through transport systems or other mechanisms as described in the discussion (upper left). In brain these proinflammatory cytokines activate microglia. Ethanol can also directly activate NF-κB transcription. Activated microglia amplify the brain neuroinflammatory response through at least three potential mechanisms. Loop 1 represents microglial synthesis and release of cytokines that activate transcription factor NF-κB to synthesize and release more inflammatory cytokines, which further activates the microglia, producing more proinflammatory signals. Loop 2 involves activation of NADPH oxidase (NOX) in microglia that produces reactive oxygen species that activate transcription factor NF-κB to synthesize and release more inflammatory cytokines. Loop 3 involves HMGB1, a TLR activator, and TLR3 on microglia that stimulates NF-κB and microglial activation. Cytokine, glutamate and/or ethanol release of HMGB1 that can activate multiple TLR receptors on microglia. Our findings of ethanol increased HMGB1 and TLR3 expression in brain support a role for loop 3 in microglial activation. Together, these amplify proinflammatory responses that spread from microglia to neurons (upper right). Neuronal expression of NOX increases oxidative stress leading to neuronal death. Minocycline and naltrexone block microglial activation and blunt neuronal death. These studies suggest that blood proinflammatory signals contribute to neuroinflammation and neurodegeneration that can be prevented by blocking microglial proinflammatory activation

Similar articles

Cited by

References

    1. Qin L, Wu X, Block ML, Liu Y, Breese GR, Hong JS, Knapp DJ, Crews FT. Systemic LPS causes chronic neuroinflammation and progressive neurodegeneration. Glia. 2007;55:453–462. doi: 10.1002/glia.20467. - DOI - PMC - PubMed
    1. Liu Y, Qin L, Wilson B, Wu X, Qian L, Granholm AC, Crews FT, Hong JS. Endotoxin induces a delayed loss of TH-IR neurons in substantia nigra and motor behavioral deficits. Neurotoxicology. 2008;29:864–870. doi: 10.1016/j.neuro.2008.02.014. - DOI - PMC - PubMed
    1. Crews FT, Zou J, Qin L. Induction of innate immune genes in brain create the neurobiology of addiction. Brain Behav Immun. 2011;Suppl 1:S4–S12. - PMC - PubMed
    1. Jiang W, Sun R, Wei H, Tian Z. Toll-like receptor 3 ligand attenuates LPS-induced liver injury by down-regulation of toll-like receptor 4 expression on macrophages. Proc Natl Acad Sci USA. 2005;102:17077–17082. doi: 10.1073/pnas.0504570102. - DOI - PMC - PubMed
    1. Finch CE, Morgan TE. Systemic inflammation, infection, ApoE alleles, and Alzheimer disease: a position paper. Curr Alzheimer Res. 2007;4:185–189. doi: 10.2174/156720507780362254. - DOI - PubMed

Publication types

MeSH terms