. 2012 Jun 18;5(1):8.
doi: 10.1186/1756-8935-5-8.

The male germ cell gene regulator CTCFL is functionally different from CTCF and binds CTCF-like consensus sites in a nucleosome composition-dependent manner

Affiliations

The male germ cell gene regulator CTCFL is functionally different from CTCF and binds CTCF-like consensus sites in a nucleosome composition-dependent manner

Frank Sleutels et al. Epigenetics Chromatin. .

Abstract

Background: CTCF is a highly conserved and essential zinc finger protein expressed in virtually all cell types. In conjunction with cohesin, it organizes chromatin into loops, thereby regulating gene expression and epigenetic events. The function of CTCFL or BORIS, the testis-specific paralog of CTCF, is less clear.

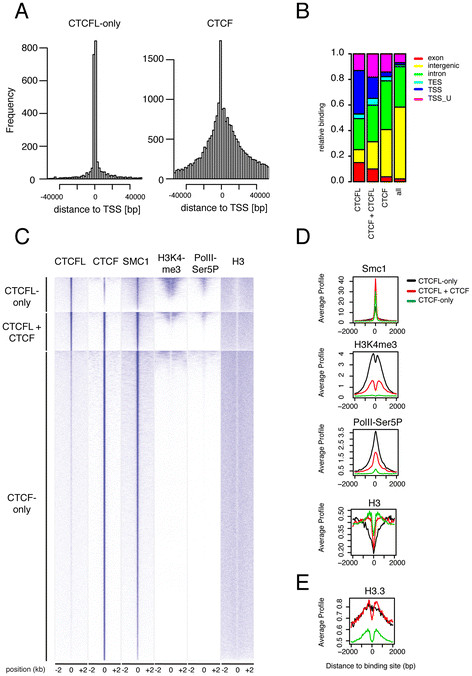
Results: Using immunohistochemistry on testis sections and fluorescence-based microscopy on intact live seminiferous tubules, we show that CTCFL is only transiently present during spermatogenesis, prior to the onset of meiosis, when the protein co-localizes in nuclei with ubiquitously expressed CTCF. CTCFL distribution overlaps completely with that of Stra8, a retinoic acid-inducible protein essential for the propagation of meiosis. We find that absence of CTCFL in mice causes sub-fertility because of a partially penetrant testicular atrophy. CTCFL deficiency affects the expression of a number of testis-specific genes, including Gal3st1 and Prss50. Combined, these data indicate that CTCFL has a unique role in spermatogenesis. Genome-wide RNA expression studies in ES cells expressing a V5- and GFP-tagged form of CTCFL show that genes that are downregulated in CTCFL-deficient testis are upregulated in ES cells. These data indicate that CTCFL is a male germ cell gene regulator. Furthermore, genome-wide DNA-binding analysis shows that CTCFL binds a consensus sequence that is very similar to that of CTCF. However, only ~3,700 out of the ~5,700 CTCFL- and ~31,000 CTCF-binding sites overlap. CTCFL binds promoters with loosely assembled nucleosomes, whereas CTCF favors consensus sites surrounded by phased nucleosomes. Finally, an ES cell-based rescue assay shows that CTCFL is functionally different from CTCF.

Conclusions: Our data suggest that nucleosome composition specifies the genome-wide binding of CTCFL and CTCF. We propose that the transient expression of CTCFL in spermatogonia and preleptotene spermatocytes serves to occupy a subset of promoters and maintain the expression of male germ cell genes.


Figures

Figure 1
Figure 1
Ctcfl and Ctcf expression and targeting. AB RNAse protection analysis of Ctcfl and Ctcf. For Ctcfl (A) RNase protection analysis (RPA) was performed on polyA purified mRNA with probes covering parts of Ctcfl exon 8 and 9 (left, small fragment) or a 5’end RACE product (right, large fragment). For Ctcf (B) the RPA was performed on total RNA with probes protecting Ctcf exon 2. The positions of the respective protected fragments are indicated with arrows. Ctcfl mRNA mRNA can only be detected in polyA purified mRNA from testis (t), whereas Ctcf is identified in total RNA from all three tissues tested. M, marker; p, input probe; c, tRNA control; h, heart; t, testis; b, brain. Aprt exon 3 is used as loading control and marked by an asterisk[28]. This analysis identifies the first exon containing the ATG translation initiation codon in Ctcfl and shows that Ctcfl is expressed in testis. C Schematic overview of the modified Ctcfl alleles and targeting constructs. The Ctcfl locus is shown on scale, with the constructs (not on scale) used for homologous recombination in ES cells underneath. Targeting at the 5’end of Ctcfl yielded the Ctcflgpf- neo allele. Cre-mediated excision of the LoxP-embedded neomcyin resistance gene yielded the Ctcflgfp allele (not shown). The 3’end targeting was performed on the Ctcflgpf- neo allele, and yielded the Ctcflgfp-neo-puro allele. Cre-mediated excision of the sequence in between the outermost LoxP sites yielded the Ctcfldel allele, in which exons 1–8 of the Ctcfl gene are deleted (not shown). A major difference between the Ctcfldel allele described here and the Ctcfl knockout published earlier [26] is that in the Ctcfldel allele the GFP coding sequence is fused in frame with the CTCFL coding sequence. Black boxes represent exons, GFP tag, neomycin and puromycin cassettes. Probes a, b, c, d and e are indicated by lines. Oligos 1, 2, 3 and 4 are represented by arrowheads. White triangles are LoxP sites. B = BglII; N = NcoI; S = SpeI; A = AvrII. D DNA blot showing Ctcfl targeting. Probes a and b were used on DNA blots from ES cells for identification of the Ctcflgfp-neo allele and probes c and d for the Ctcflpuro allele. Probe e identifies the Ctcfldel allele from Ctcflgfp-neo-puro mice that were crossed to a chicken Actin-Cre transgene. Probe a, HindIII digest (wt 8.9 kb, ko 5.7 kb); probe b, EcoRI digest (wt 14 kb; ko 11 kb); probe c, BamHI digest (wt 16.1 kb; ko 6.8 kb); probe d, BamHI digest (wt 16.1 kb; ko 11.1 kb). E Absence of Ctcfl DNA in the Ctcfldel allele. PCR on tail DNA indicates that Ctcfldel/del mice are deleted for exons 1–8 (top three panels) and are positive for GFP (oligos 2 and 4). F Absence of Ctcfl RNA in Ctcfl mutant mice. PCR on cDNA derived from testis mRNA shows that Ctcfl is absent from Ctcfldel/del mice. Acrosin and Gapd function as positive controls. G Schematic overview of the Ctcf allele and targeting strategy for the Ctcfgfp-neo allele. The Ctcf locus is shown on scale, with the construct (not on scale) used for homologous recombination in ES cells underneath. Cre-mediated excision of the LoxP-embedded neomcyin resistance gene yielded the Ctcfgfp (or Ctcfki) allele (not shown). Black boxes represent exons, GFP tag and neomycin cassette. Oligos 5, 6, 7 and 8 are represented by arrowheads. White triangles are LoxP sites. E = EcoRI. H PCR confirming Ctcfgpf-neo allele. Identification of the CTCFgfp-neo (or Ctcfki) allele by PCR with oligos 7 and 8 or oligos 5, 6 and 8 (see panel G). I Western blot confirming GFP-CTCF expression from the Ctcfgfp allele. We isolated MEFS from E13.5 day wild-type (+/+), heterozygous Ctcfgfp/+ (or Ctcfki/+) or homozygous Ctcfgfp/gfp (or Ctcfki/ki) embryos, and identified the GFP-CTCF fusion protein by Western blot of MEF extracts using anti-CTCF or anti-GFP antibodies. Note the increased size of the GFP-CTCF protein compared to the CTCF protein due to the GFP tag.
Figure 2
Figure 2
Expression of CTCFL and CTCF in the testis. A-C Immunohistochemical staining of testis sections. Paraffin-embedded sections from day 90 testes from heterozygous (del/+) and homozygous (del/del) Ctcfl mutant mice were stained with anti-CTCFL, followed by diaminobenzidine (DAB) coloring. Some of the CTCFL-positive cells are indicated with black arrowheads. Scale bars A, C: 100 μm, B: 50 μm. D-G Immunofluorescence staining of testis sections. Sections as described in A-C were stained with CTCFL (D and F) or STRA8 (E and G) antibodies. STRA8-positive cells in panels E and G are indicated with green arrowheads; the same cells are indicated with red arrowheads in the sections stained with anti-CTCFL antibodies (panels D and F). In Ctcfl mutant mice, STRA8 distribution is not changed. Scale bar is 50 μm. H-P Ex vivo confocal and multiphoton imaging of intact seminiferous tubules. Testis tubules were dissected from GFP-CTCFL- (H-M) or GFP-CTCF- (N-P) expressing mice, exposed to Hoechst at the adluminal side of the seminiferous tubule, and analyzed with a confocal/multiphoton microscope (GFP-CTCFL and GFP-CTCF, green; Hoechst, red). Panel H-J (see also Movie S1) shows a low magnification view of GFP-CTCFL distribution. Notice the presence of GFP-CTCFL-positive cells in the upper half of the tubule and their absence in the bottom half, indicating a transient population of cells. In (K-M) a high-magnification view of the same GFP-CTCFL-positive cells is shown. Notice the non-homogenous distribution of GFP-CTCFL in the nucleus. In (N-P) GFP-CTCF staining is shown. For clarity, some of the cell types are encircled, and their position is indicated in the other panels using white arrowheads. Pl = preleptone spermatocyte; rs = round spermatid; pa = pachytene spermatocyte; se = Sertoli cell. Bars, H-J: 70 μm, K-M: 10 μm, N-P: 25 μm.
Figure 3
Figure 3
CTCFL is important for spermatogenesis. A Testicular weight distribution. The testicular weight of Ctcfl heterozygous (Ctcfldel/+; diamonds) and homozygous (Ctcfldel/del; circles) mice was measured and plotted as a normalized probability distribution (i.e., the surface under the curve represents a total probability of 1). Testes of knockout mice are significantly smaller (p < 0.0005, t-test). White symbols represent infertile males, black symbols are fertile males, and grey symbols correspond to males not tested for fertility. B Ctcfl mutant mice display reduced fertility. Epididymal sperm count from Ctcfl heterozygous (Ctcfldel/+; black bar) and homozygous (Ctcfldel/del; grey bar) mice. Standard deviation is plotted (p = 0.0002, n = 4). C Testis histology. In the left three panels a timed series of HE-stained testicle sections is shown (postnatal day 21, 28, 90), while in the right hand panel an apoptosis assay (TUNEL staining) of testicle sections at day 90 is shown. Note that in CTCFL-deficient testes some seminiferous tubules appear normal, whereas others (which can be adjacent to the normal ones) have lost most of their meiotic and post-meiotic germ cells, leaving only mitotic spermatogonia (that stain positive for BrdU incorporation, see panel E) and Sertoli cells. Yet other tubules contain disorganized spermatocytes, and some of them even elongated sperm. Thus, there is no absolute block in differentiation or progression of germ cell development, but the incomplete penetrance of the infertility phenotype is however directly linked to the testicle weight (panel A) and to the degenerative level of the seminiferous tubules. D Apoptosis plot. Number of TUNEL-positive apoptotic cells per 100 seminiferous tubules counted at day 28 and day 90. Standard deviation of three animals per genotype and time point is indicated. E DNA synthesis marked by a 1-h pulse of BrdU in day 40 testicles reveals that mitotic spermatogonia are still present in degenerated tubules. Counterstaining with hematoxylin. F SCP3 staining in spermatocytes of day 90 testicles as a marker for tubule organization. G PRSS50 co-localizes only partially with STRA8. Immunofluorescence staining with a STRA8 antibody (top panel) or PRSS50 antibody (bottom panel) of adult testicle sections shows that PRSS50 and STRA8 expression overlaps only partially. Scale bars are 50 μm.
Figure 4
Figure 4
Regulation of testis-specific genes by CTCFL. A Heatmap representation of microarray data. We compared five samples from heterozygous and three samples from homozygous Ctcfl knockout mice. Depicted are the top 27 deregulated genes, where the log2-transformed fold change compared to the average expression in heterozygous testis is shown. B Expression analyses in Ctcfl mutant testes. Real-time RTPCR expression analyses on testis RNA from Ctcfl mutant mice relative to wild type using Ccna1 as reference. Genes were examined in 90-day-old testes. C Reduced PRSS50 expression in Ctcfl mutant testis. Immunofluorescence analysis of testis sections from heterozygous (del/+) and homozygous (del/del) Ctcfl knockout mice, using antibodies against PRSS50.
Figure 5
Figure 5
Genome-wide analysis of CTCFL expression in ES cells. A Inducible expression of CTCFL-V5-GFP in ES cells. Notice the nuclear localization of CTCFL-V5-GFP in cells expressing the protein. B Flow chart of experiments. ES cells with a Tet-on inducible expression of a CTCFLV5-GFP transgene were sorted for GFP and used for microarray and ChIP-Seq analyses. C CTCFL expression and DNA binding are associated with elevated gene expression levels. We plotted gene expression levels, as determined by microarray analysis of induced (ind) or non-induced ES cells, for all genes (all), or those bound by CTCF, or CTCFL, to the respective promoter region (−2 k to +1 kb around TSS). Differences are highly significant (p-value CTCF-ind versus CTCFL-ind: 5.1 × e-14; p-value CTCF versus CTCFL: 5.9 × e-13). D Transcript analyses in ES cells expressing CTCFL-V5-GFP. Real-time RT-PCR expression analyses of CTCFL-V5-GFP-induced and GFP-sorted ES cells, relative to non-induced ES cells, for the indicated genes, referenced to Cdk2 expression. E Venn diagram of DNA-binding sites for CTCFL and CTCF. F Clustered heatmap representation of three classes of CTCF/CTCFL-binding sites. Shown are the binding profiles of CTCFL and CTCF (1: our own data; 2: [7]) across all CTCF/CTCFL-binding sites identified in mES cells. Sites are grouped into CTCFL-only, CTCF-only, and combined CTCFL and CTCF sites. Within the three classes, data sets were sorted decreasingly from top to bottom for average binding across the interval from 2 kb to +2 kb around the identified binding peak center positions. Additionally the occurrences of predicted CTCFL motifs within these intervals are plotted. G Motif comparison of CTCF and CTCFL. DNA-binding motif for CTCFL-only (top panel), CTCF + CTCFL (middle panel) and CTCF-only binding sites (bottom panel).
Figure 6
Figure 6
Characterization of CTCFL and CTCF binding. A A large fraction of CTCFL-binding sites is located close to promoters. We determined for each CTCFL-only-binding site the distance to the nearest transcriptional start site (TSS) and plotted the frequencies of binding sites in the depicted window from −40 kb to +40 kb around the center of CTCFL-binding sites. CTCF is plotted as comparison. B Comparison of the genomic distribution of CTCF- and CTCFL-binding sites. Sites are separated into CTCF-only, CTCFL-only and (CTCF + CTCF). The entire genome is also plotted (all). The binding location is separated into exon, intron, intergenic, transcription start site (TSS) and transcriptional end sites (TES), and plotted as frequencies of total (Y ax). C Clustered heatmap representation of the three different classes of CTCF/CTCFL-binding sites with respect to chromatin context. We compared CTCF and CTCFL binding to published ChIP-sequencing data sets for the cohesin complex subunit Smc1, H3K4me3, a phosphorylated form (serine 5) of RNA PolII, (PolIISer5P) and histone H3 [8,42,43]. D Cumulative profiles across the three different classes of CTCF/CTCFL-binding sites with respect to chromatin context. The average ChIP-sequencing profiles are shown for the same data sets as in (C). E Cumulative profiles across the three different classes of CTCF/CTCFL-binding sites with respect to H3.3.
Figure 7
Figure 7
Characterization of CTCF and CTCFL binding. A Examples of CTCF- and CTCFL-binding site location. The genomic location of CTCF (upper part) and CTCFL (middle and bottom parts) binding sites in the absence (−CTCFL, middle) or presence (+CTCFL, bottom) of CTCFL, within the Stra8, Prss50 and Gal3st1 genes. The vertical axes show the number of unique sequence reads. B CTCFL binds to Stra8 and Prss50. Band shift analyses of GFP-CTCFL on Stra8 and Prss50 fragments. GFP-CTCFL binding can be super shifted (marked with asterisks) with anti-GFP, but not with an Actin antibody. Band shifts were performed under excess probe conditions. C In vitro effect of CTCFL on CTCF binding. Band shift analyses with GFP-CTCF and/or GFP-CTCFL on Prss50- and Stra8-bindings sites. GFP-CTCFL is added in increasing amounts (1-, 2-, 5- and 10-fold compared to GFP-CTCF). To allow competition, the band shift was performed under probe-limiting concentrations. D Cellular effect of CTCFL on CTCF binding. ChIP analyses with CTCFL (blue), CTCF (red) and pre-immune (yellow) antisera in ES cells that were either non-transfected (−) or transiently transfected CTCFL-V5-GFP (+). According to ChIP-sequencing data, Prss50, Stra8 and Vps18 bind both CTCF and CTCFL, whereas Gal3st1 only binds CTCFL, and Chr10 only binds CTCF. A CTCF- and CTCFL-negative site within the Amylase gene is used as reference and set to 1. Error bars represent standard deviations of biological replicates. E Competition between CTCF and CTCFL in ES cells. Genome-wide binding of CTCF was compared to that of CTCFL by ChIP-Seq using non-transfected ES cells and ES cells transiently transfected with GFP-CTCFL. The left hand panel shows the effect of CTCFL binding on shared CTCFL/CTCF sites that showed >1.5 fold difference in CTCF binding. The effect is categorized into sites with increased (up) or decreased (down) CTCF binding. The right hand panel shows a more general effect of CTCFL binding on CTCF binding. Here, we examined the change in CTCF binding in all shared CTCF(L)-binding sites (all) compared to those shared sites that were significantly changed in CTCF binding (changed). The effect on CTCF binding is plotted as log2-fold difference. F In vivo CTCF(L) binding. ChIP was performed using anti-CTCF (red) or anti-CTCFL (blue) antibodies, or pre-immune serum, on the indicated sites (A: Amylase, S: Stra8, P: Prss50, V: Vps18) in nuclei from dissociated seminiferous tubules, partly purified by elutriation. Relative enrichment is shown compared to Amylase.
Figure 8
Figure 8
CTCFL is functionally different from CTCF A Strategy for the rescue of CTCF-depleted ES cells. Ctcflox/lox ES cells were infected with lentivirus containing the Cre recombinase and/or fluorescently tagged CTCF(L) proteins. After infection neomycin-resistant colonies were picked and analyzed. m = mouse, g = chicken. B Analysis of Ctcflox/lox deletion. After infection with CRE-containing constructs, Ctcflox/lox ES cells were scored for the status of the conditional Ctcf alleles by DNA blot. The position of wild-type (wt), deleted (Ctcfdel, or del) and conditional (Ctcflox, or lox) loci in control ES cells (C), non-treated Ctcflox/lox ES cells (1) and lentivirally transduced Ctcflox/lox ES cells (25, see panel A for numbering of constructs) is indicated. Cells are considered rescued when both conditional CTCF alleles have been deleted. C Analysis of CTCF protein expression. Neomycin-resistant colonies were grown and analyzed by Western blot for CTCF (upper panel) or GFP (lower panel) expression. Note that rescued cells are negative for endogenous CTCF. D, E GFP-CTCFL is a functional protein. ES cells were transiently transfected and harvested after 1 day. ChIP (DNA, D) and RT-PCR (mRNA, E) analyses revealed that GFP-CTCFL binds Vps18, Stra8 and Prss50 promoters (D) and is able to induce expression of Gal3st1, Stra8 and Prss50 (E).

Similar articles

Cited by

References

    1. Bartkuhn M, Renkawitz R. Long range chromatin interactions involved in gene regulation. Biochimica et biophysica acta. 2008;1783:2161–2166. - PubMed
    1. Handoko L, Xu H, Li G, Ngan CY, Chew E, Schnapp M, Lee CW, Ye C, Ping JL, Mulawadi F. et al.CTCF-mediated functional chromatin interactome in pluripotent cells. Nature Genetics. 2011;43:630–638. - PMC - PubMed
    1. Phillips JE, Corces VG. CTCF: master weaver of the genome. Cell. 2009;137:1194–1211. - PMC - PubMed
    1. Heath H, Ribeiro De Almeida C, Sleutels F, Dingjan G, Van De Nobelen S, Jonkers I, Ling KW, Gribnau J, Renkawitz R, Grosveld F. et al.CTCF regulates cell cycle progression of alphabeta T cells in the thymus. Embo J. 2008;27:2839–2850. - PMC - PubMed
    1. Ribeiro De Almeida C, Heath H, Krpic S, Dingjan GM, Van Hamburg JP, Bergen I, Van De Nobelen S, Sleutels F, Grosveld F, Galjart N, Hendriks RW. Critical role for the transcription regulator CCCTC-binding factor in the control of Th2 cytokine expression. J Immunol. 2009;182:999–1010. - PubMed