. 2013 Aug;23(8):1811-23.
doi: 10.1093/cercor/bhs159. Epub 2012 Jun 17.

The LIM homeodomain protein Lhx6 regulates maturation of interneurons and network excitability in the mammalian cortex

Affiliations

The LIM homeodomain protein Lhx6 regulates maturation of interneurons and network excitability in the mammalian cortex

Guilherme Neves et al. Cereb Cortex. 2013 Aug.

Abstract

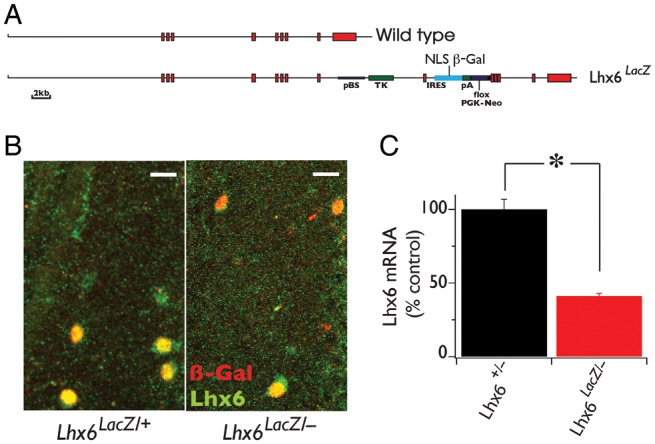
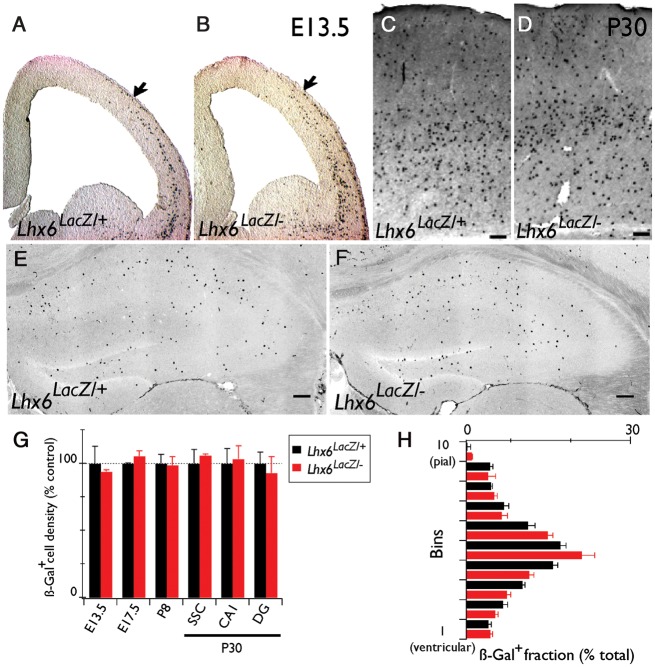
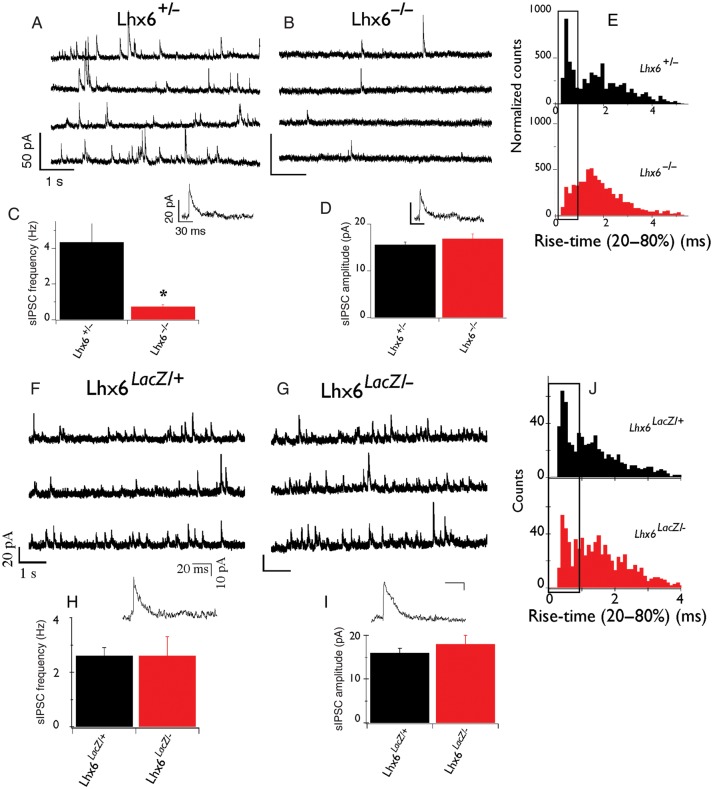
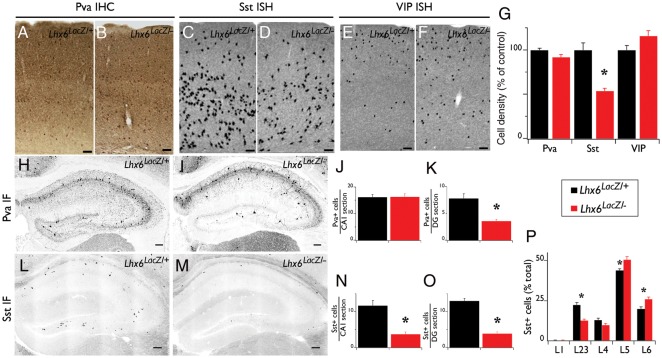
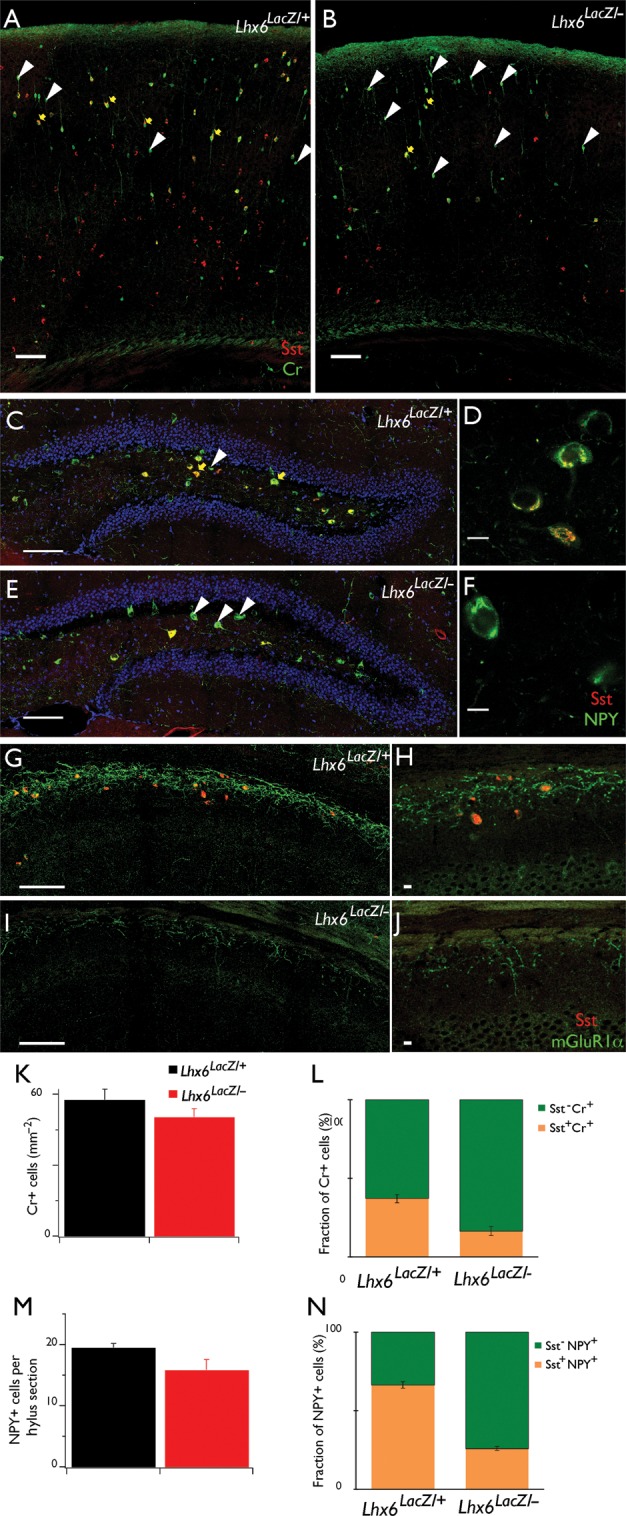
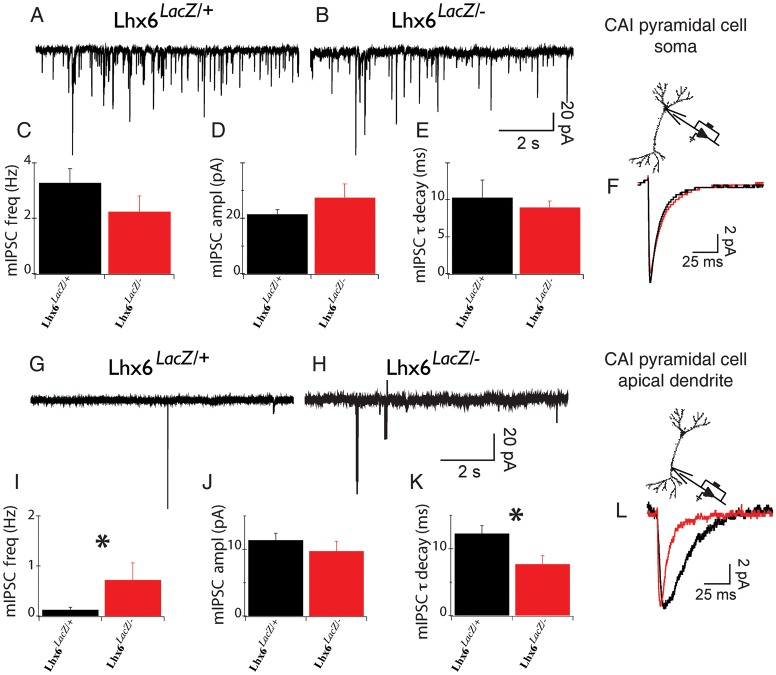
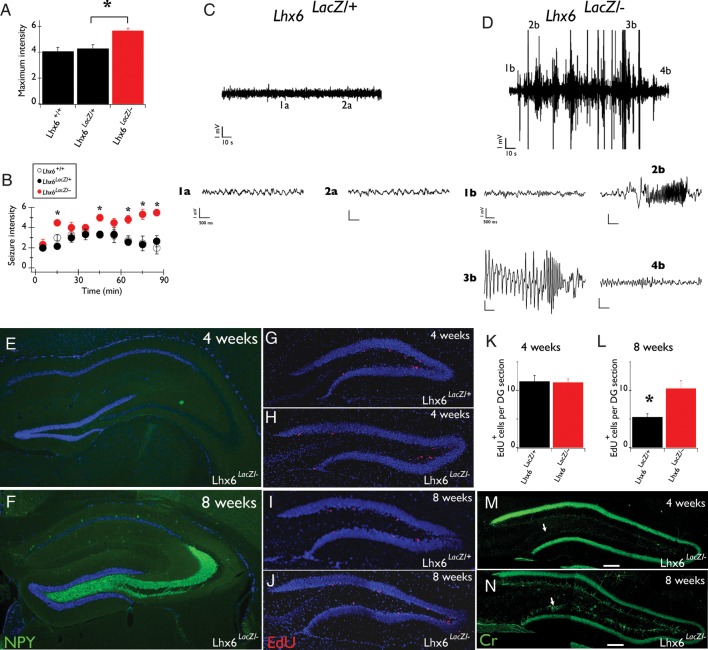
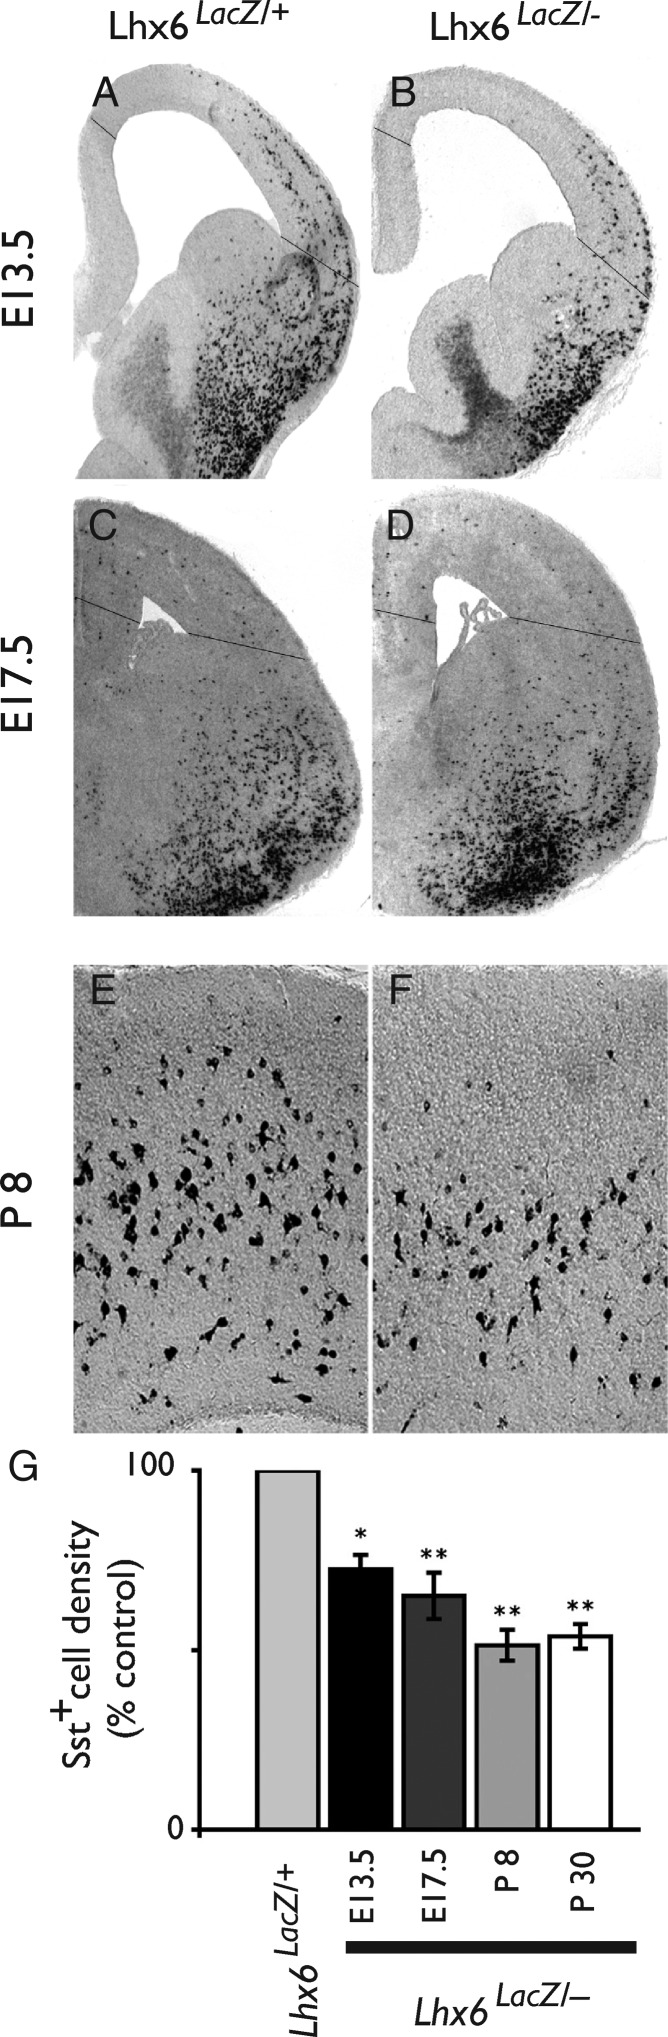
Deletion of LIM homeodomain transcription factor-encoding Lhx6 gene in mice results in defective tangential migration of cortical interneurons and failure of differentiation of the somatostatin (Sst)- and parvalbumin (Pva)-expressing subtypes. Here, we characterize a novel hypomorphic allele of Lhx6 and demonstrate that reduced activity of this locus leads to widespread differentiation defects in Sst(+) interneurons, but relatively minor and localized changes in Pva(+) interneurons. The reduction in the number of Sst-expressing cells was not associated with a loss of interneurons, because the migration and number of Lhx6-expressing interneurons and expression of characteristic molecular markers, such as calretinin or Neuropeptide Y, were not affected in Lhx6 hypomorphic mice. Consistent with a selective deficit in the differentiation of Sst(+) interneurons in the CA1 subfield of the hippocampus, we observed reduced expression of metabotropic Glutamate Receptor 1 in the stratum oriens and characteristic changes in dendritic inhibition, but normal inhibitory input onto the somatic compartment of CA1 pyramidal cells. Moreover, Lhx6 hypomorphs show behavioral, histological, and electroencephalographic signs of recurrent seizure activity, starting from early adulthood. These results demonstrate that Lhx6 plays an important role in the maturation of cortical interneurons and the formation of inhibitory circuits in the mammalian cortex.

Keywords: LIM homeodomain protein; Lhx6; cortical interneurons.


Figures

Figure 1.
Figure 1.
Lhx6LacZ is a novel hypomorphic allele of the Lhx6 locus. (A) Genomic organization of the wild type (top) and the Lhx6LacZ (bottom) alleles of Lhx6. Exons are represented by red boxes. (B) Double-IF staining of hippocampal CA1 stratum oriens from Lhx6LacZ/+ and Lhx6LacZ/− animals using antibodies specific for Lhx6 (green) and β-gal (red). (C) The transcriptional activity of the wild type and Lhx6LacZ alleles was compared (in the background of the null allele) using quantitative real-time polymerase chain reaction with cDNA generated from the forebrain of adult Lhx6+/− and Lhx6LacZ/− animals (P60) as template and TaqMan probes for Lhx6 mRNA. Error bars show SEM. *P < 0.05. n = 3 animals per genotype. Scale bars 20 μm.
Figure 2.
Figure 2.
Normal number and distribution of cortical interneurons in Lhx6LacZ/− animals. (A and B) X-Gal staining of coronal brain sections from E13.5 Lhx6LacZ/+ and Lhx6LacZ/− embryos. Coronal brain sections from Lhx6LacZ/+ and Lhx6LacZ/− animals processed for IHC (neocortex, C and D) or IF (hippocampus, E and F) with a β-gal–specific antibody. (G) Average density of β-gal+ cells in the pallium (for embryos) or the somatosensory cortex (for P8 and P30) and the CA1 and DG areas of the hippocampus of Lhx6LacZ/+ and Lhx6LacZ/− animals at the indicated developmental stages. (H) Quantification of the radial distribution of β-gal+ cells in the somatosensory cortex. n = 3 animals were analyzed per genotype, area, and developmental stage. Scale bars = 100 μm.
Figure 3.
Figure 3.
Lhx6 null but not hypomorphic animals have severe reduction in inhibitory synaptic currents. (A and B) Representative voltage-clamp recordings from DG granule cells of control (Lhx6+/−; A) and Lhx6/− (B) slices. Individual IPSCs with increased temporal resolution are also shown. Units at scale bars in A and B are the same. (C) Average frequency of sIPSCs and (D) average amplitude of sIPSCs from control and mutant slices. (E) Normalized histogram of sIPSC rise time (20–80%) from control (black) and mutant (red) slices. Boxed area indicates events with rapid kinetics. *P < 0.05. n = 12 cells (6 animals) control and 21 cells (8 animals) mutants. In contrast to Lhx6-deficient animals, normal sIPSCs were recorded from the somatic compartment of DG granule cells from Lhx6LacZ/− animals. (F and G) Representative voltage-clamp recordings from DG granule cells from control (F) and Lhx6LacZ/− (G) slices. Individual IPSCs with increased temporal resolution are also shown. Units of scale bars in F and G are the same. Average frequency (H) and amplitude (I) of sIPSCs from control and Lhx6LacZ/− animals. (J) Histograms of sIPSC rise times from control (top) and Lhx6LacZ/− (bottom) animals show no major difference between control (black) and mutant (red) slices. n = 18 cells (from 9 Lhx6LacZ/+ animals) and 27 cells (from 11 Lhx6LacZ/− mutants).
Figure 4.
Figure 4.
Differentiation defects of cortical interneurons in Lhx6 hypomorphic animals. IHC of coronal brain sections from control (Lhx6LacZ/+; A) and Lhx6 hypomorphic (Lhx6LacZ/−; B) animals with antibodies specific for Pva. In situ hybridization of coronal brain sections from control (C and E) and Lhx6 hypomorphic (D and F) animals with a Sst (C and D) or a vasoactive intestinal peptide (VIP) riboprobe (E and F). (G) Quantification of the density of interneurons expressing the indicated markers from the somatosensory cortex of Lhx6 hypomorphic animals (red bars) relative to their control littermates (black bars); n = 3 animals per genotype. IF in the hippocampus of control (H and L) and of Lhx6 hypomorphic (I and M) animals with antibodies specific for Pva (H and I) or Sst (L and M). (J, K, N, O) Quantification of IF experiments; n = 5 animals per genotype. (P) An increased proportion of the Sst+ cells are located in the deeper layers of the neocortex of Lhx6 hypomorphs; n = 7 animals per genotype. All significant differences (P < 0.05) are indicated above the graphs with an asterisk. Scale bars 100 μm.
Figure 5.
Figure 5.
Partial differentiation of Sst+ interneurons in Lhx6 hypomorphic animals. Double IF of coronal brain sections from control (A) and Lhx6 hypomorphic (B) animals with antibodies specific for Cr (green) and Sst (red). No changes were observed in the total density of Cr+ cells (K), but the fraction of Cr+ cells that co-express Sst (yellow arrows in A and B, orange bars in L) is significantly reduced in Lhx6 hypomorphic animals, resulting in an increased fraction of Cr+Sst cells (white arrowheads in A and B, green bars in L). Double IF of the DG hylus region from control (C) and Lhx6 hypomorphic (E) animals with antibodies specific for NPY (green) and Sst (red). No changes were observed in the total number of NPY+ cells (M), but the fraction NPY+Sst+ cells (yellow arrows in C and E, orange bars in N) is reduced in hypomorphs. (D and F) show single confocal sections of representative examples of NPY+Sst+ (D) and NPY+Sst (F) cells at higher resolution. Double IF of the stratum oriens of the CA1 region of the hippocampus from control (G) and Lhx6 hypomorphic (I) animals with antibodies specific for mGluR1α (green) and Sst (red), showing reduced expression of mGluR1α in mutant animals. (H and J) show single confocal sections at higher resolution. Scale bars 100 μm (A, B, C, E, G, I) and 10 μm (D, F, H, J). In (CF), cell nuclei are counterstained with 4',6-diamidino-2-phenylindole (DAPI) (blue), to reveal the granule cell layer.
Figure 6.
Figure 6.
Miniature synaptic currents recorded from dendrites of Lhx6LacZ/− animals show specific changes of their properties. (A and B) Representative mIPSC traces obtained from the soma of Lhx6LacZ/+ (A) and Lhx6LacZ/− (B) CA1 pyramidal neurons. (CE) Average frequency (C), amplitude (D), and decay time constants (E) of mIPSCs from the soma of 14 Lhx6LacZ/+ and 12 Lhx6LacZ/− neurons. (F) Overlay of the average mIPSC obtained from control (Lhx6LacZ/+; black) and Lhx6LacZ/− (red) cells. (G and H) mIPSC recordings obtained from apical dendrites (200 µm from the soma) of hippocampal CA1 neurons from Lhx6LacZ/+ (G) and Lhx6LacZ/− (H) animals. (IK) Mean frequency (I), amplitude (J), and decay (K) of mIPSCs from 7 Lhx6LacZ/+ and 6 Lhx6LacZ/− dendrites. *P < 0.05. (L) Overlay of average dendritic mIPSCs from Lhx6LacZ/+ (black) and Lhx6LacZ/− (red). Note statistically significant changes in the average frequency (I) and decay (K).
Figure 7.
Figure 7.
Lhx6LacZ/− animals show spontaneous seizures from early post-natal stages. (A) The maximum intensity of convulsions of Lhx6LacZ/− (red bar) and control Lhx6LacZ/+ or Lhx6+/+ littermates (black bars) upon administration of 19 mg/kg kainic acid. (B) Severe convulsions appeared earlier and lasted longer in Lhx6LacZ/− animals (red circles) relative to controls (Lhx6LacZ/+, black circles and Lhx6+/+, white circles). Asterisks represent statistically significant (P < 0.01) differences between Lhx6LacZ/− and control littermates. (C) Typical EEG from the hippocampus of a freely moving control (Lhx6LacZ/+) animal. (1a and 2a) show increased temporal resolution of the areas indicated in C. (D) EEG during seizure from a hypomorphic animal (Lhx6LacZ/−), demonstrating different seizure stages: 1b—Baseline EEG, 2b—beginning of seizure, 3—late stages of seizure, and 4b—return to baseline after seizure. The same units apply to all scale bars in 1a, 2a, and 1b–4b. (E and F) NPY IF in the hippocampus of 4-week (E) and 8-week–old (F) Lhx6LacZ/− animals. Note the intense NPY staining specifically in mossy fibers of 8-week–old animals. (GJ) EdU incorporation in the inner margin of the granular cell layer of the DG of 4-week (G and H) and 8-week–old (I and J) control (Lhx6LacZ/+; G and I) and hypomorphic (Lhx6LacZ/−; H and J) animals. (K and L) Quantification of the experiment shown in GJ for 4-week (K) and 8-week–old (L) animals. *P = 0.01, n = 3 Lhx6LacZ/+ animals, or n = 6 Lhx6LacZ/− animals. (M and N) Cr IF in the hippocampus of 4-week (M) and 8-week–old (N) Lhx6LacZ/− animals. Note that Cr-specific signal is observed in the inner area of the granular cell layer (arrows) of 8-week–old animals. In all relevant panels DAPI counterstaining is shown in blue.
Figure 8.
Figure 8.
The deficit of Sst+ neurons in the cortex of Lhx6LacZ/− animals is already present at embryonic stages. (AF) In situ hybridization of brain sections from E13.5 (A and B), E17.5 (C and D), P8 (E and F), control (Lhx6LacZ/+; A, C, E), and Lhx6LacZ/− B, D, F) animals using an Sst-specific riboprobe. (G) Quantification of the average density of Sst+ cells in the pallium (area between the lines in AD) or the somatosensory cortex (for P8 and P30) in Lhx6LacZ/− animals relative to their control (Lhx6LacZ/+) counterparts (*P < 0.05 and **P < 0.01; n = 3 animals per genotype and developmental stage).

Similar articles

Cited by

References

    1. Ali AB, Thomson AM. Synaptic alpha 5 subunit-containing GABAA receptors mediate IPSPs elicited by dendrite-preferring cells in rat neocortex. Cereb Cortex. 2008;18:1260–1271. doi:10.1093/cercor/bhm160. - DOI - PubMed
    1. Alifragis P, Liapi A, Parnavelas JG. Lhx6 regulates the migration of cortical interneurons from the ventral telencephalon but does not specify their GABA phenotype. J Neurosci. 2004;24:5643–5648. doi:10.1523/JNEUROSCI.1245-04.2004. - DOI - PMC - PubMed
    1. Andersen P, Eccles JC, Loyning Y. Recurrent inhibition in the hippocampus with identification of the inhibitory cell and its synapses. Nature. 1963;198:540–542. doi:10.1038/198540a0. - DOI - PubMed
    1. Andrasfalvy BK, Mody I. Differences between the scaling of miniature IPSCs and EPSCs recorded in the dendrites of CA1 mouse pyramidal neurons. J Physiol. 2006;576:191–196. doi:10.1113/jphysiol.2006.115428. - DOI - PMC - PubMed
    1. Ascoli GA, Alonso-Nanclares L, Anderson SA, Barrionuevo G, Benavides-Piccione R, Burkhalter A, Buzsaki G, Cauli B, Defelipe J, Fairen A, et al. Petilla terminology: nomenclature of features of GABAergic interneurons of the cerebral cortex. Nat Rev Neurosci. 2008;9:557–568. doi:10.1038/nrn2402. - DOI - PMC - PubMed

Publication types

MeSH terms