. 2013 Aug;23(8):1798-810.
doi: 10.1093/cercor/bhs154. Epub 2012 Jun 17.

Age-based comparison of human dendritic spine structure using complete three-dimensional reconstructions

Affiliations

Age-based comparison of human dendritic spine structure using complete three-dimensional reconstructions

Ruth Benavides-Piccione et al. Cereb Cortex. 2013 Aug.

Abstract

Dendritic spines of pyramidal neurons are targets of most excitatory synapses in the cerebral cortex. Recent evidence suggests that the morphology of the dendritic spine could determine its synaptic strength and learning rules. However, unfortunately, there are scant data available regarding the detailed morphology of these structures for the human cerebral cortex. In the present study, we analyzed over 8900 individual dendritic spines that were completely 3D reconstructed along the length of apical and basal dendrites of layer III pyramidal neurons in the cingulate cortex of 2 male humans (aged 40 and 85 years old), using intracellular injections of Lucifer Yellow in fixed tissue. We assembled a large, quantitative database, which revealed a major reduction in spine densities in the aged case. Specifically, small and short spines of basal dendrites and long spines of apical dendrites were lost, regardless of the distance from the soma. Given the age difference between the cases, our results suggest selective alterations in spines with aging in humans and indicate that the spine volume and length are regulated by different biological mechanisms.

Keywords: 3D reconstructions; Lucifer Yellow; cerebral cortex; confocal; intracellular.


Figures

Figure 1.
Figure 1.
(A) Confocal microscopy image of an intracellular injected layer III pyramidal neuron of the human cingulate cortex. DAPI staining in blue. (B) High magnification image showing a horizontally projecting basal dendrite, to illustrate the extent of the labeling. Notice the virtual lack of dendritic spines in the proximal dendritic segment. (C) High magnification image of an apical dendritic segment acquired at 100 μm distance from the soma. (D) Three-dimensional reconstruction of the complete morphology of each dendritic spine shown in (C). (E) Estimation of the spine volume values shown in (D) by color codes (blue-white: 0.0–1.345 μm3). Scale bar (in B): 40 μm in A; 13 μm in B; and 7 μm in C–E.
Figure 2.
Figure 2.
Dendritic shaft and dendritic spine reconstruction. (A) Confocal microscopy image showing a labeled basal dendritic segment. (B) For each dendrite, dendritic shaft volume (white) was 3D reconstructed by selecting a particular threshold that represented a solid surface that matched the contour of the dendritic shaft along the length of the dendrite. (C) To 3-dimensionally reconstruct the complete morphology of each dendritic spine, 7–10 different intensity thresholds were created (i1–8) and then, a particular threshold was selected to constitute a solid surface that exactly matched the contour of that dendritic spine (i9). (D) The sequence described in (C) was repeated for each individual dendritic spine to reconstruct each dendritic spine volume along the length of the dendrite. The combination of dendritic shaft volume and all dendritic spine volumes represents the total volume of the dendrite. (E) For each individual dendritic spine, its length was manually marked from its point of insertion in the dendritic shaft to the distal tip of the dendritic spine, while rotating the image in 3 dimensions (see i10 in C). Scale bar (in E): 6 μm in A, B, D, and E and 2.3 μm in C.
Figure 3.
Figure 3.
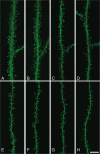
Examples of apical and basal dendritic segments. Confocal microscope images showing labeled apical (A–D) and basal (E–H) dendrites from case C40 (A, B, E, and F) and C85 (C, D, G, and H). Scale bar (in H): 6 μm in A–H.
Figure 4.
Figure 4.
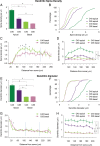
Dendritic spine density and dendritic diameter measurements in apical and basal dendrites. (A–D) Graphs showing the mean dendritic spine density (A), cumulative frequency distributions (B), and distribution of dendritic spine density as a function of the distance from the soma (C and D) in individuals C40 and C85. (E–H) Graphs showing the mean dendritic diameter (E), cumulative frequency distributions (F), and distribution of dendritic diameter as a function of the distance from the soma (G and H) in individuals C40 and C85. Blue lines in (C) and (G) correspond to the 100–200 μm segment of basal dendrites shown in the corresponding panels (D) and (H). Asterisks indicates the presence of significant differences. See Supplementary Tables S1–S4 for details of statistical comparisons.
Figure 5.
Figure 5.
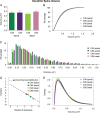
Dendritic spine volume analysis. (A–C) Graphs showing dendritic spine volume measurements represented as mean values per dendrite (A), cumulative distribution functions (B), and frequency distribution histograms (as percent) (C) in apical and basal dendrites of individuals C40 and C85. See Supplementary Tables S1 and S2 for statistical comparisons. (D) The Cullen and Frey graph (skewness–kurtosis plot) displaying the relationship between the square of skewness and the kurtosis of standard distributions for dendritic spine volumes. (E) Graph showing the density of the estimated gamma distributions for dendritic spine volumes from apical and basal dendrites of cases C40 and C85, with the parameters of shape and rate corresponding to Table 2.
Figure 6.
Figure 6.
Dendritic spine volume and length measurements as a function of the distance from the soma. Graphs showing the distribution of values as a function of the distance from the soma for dendritic spine volumes (A and B) and lengths (C and D) in basal (A and C), and apical (B and D) dendrites in individuals C40 and C85. Blue lines in (A) and (C) correspond to the 100–200 μm segment of basal dendrites shown in the corresponding panels (B) and (D). Asterisks indicates the presence of significant differences. See Supplementary Tables S3 and S4 for details of statistical comparisons.
Figure 7.
Figure 7.
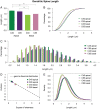
Dendritic spine length analysis. (AC) Graphs showing dendritic spine length measurements represented as mean values (A), cumulative distribution functions (B), and frequency distribution histograms (as percent) (C) in apical and basal dendrites of individuals C40 and C85. See Supplementary Tables S1 and S2 for statistical comparisons. (D) The Cullen and Frey graph (skewness–kurtosis plot) displaying the relationship between the square of skewness and the kurtosis of standard distributions for dendritic spine lengths. (E) Graph showing the density of the estimated gamma distributions for dendritic spine lengths from apical and basal dendrites of cases C40 and C85, with the parameters of shape and rate corresponding to Table 3.
Figure 8.
Figure 8.
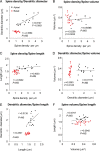
Correlation analyses in apical (black dots) and basal (red dots) regions between the various morphological parameters analyzed. Each point represents the values obtained in one dendrite of a different cell. Significant correlations were classified as weak [Spearman's rho (r) value lower than 0.40], moderate (0.4 < r < 0.7), and strong (r > 0.7). n = 16 dendrites for all apical comparisons and n = 20 dendrites for all basal comparisons. See also Supplementary Tables S5 and S6 for further apical and basal relations.
Figure 9.
Figure 9.
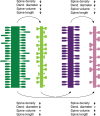
Schematic representation showing main statistical differences in morphological parameters found between apical (dark colors) and basal (light colors) dendritic compartments of individual C40 (green) and C85 (purple).

References

    1. Anderson K, Bones B, Robinson B, Hass C, Lee H, Ford K, Roberts TA, Jacobs B. The morphology of supragranular pyramidal neurons in the human insular cortex: a quantitative Golgi study. Cerebral Cortex. 2009;19:2131–2144. - PubMed
    1. Araya R, Jiang J, Eisenthal KB, Yuste R. The spine neck filters membrane potentials. Proc Natl Acad Sci USA. 2006;103:17961–17966. - PMC - PubMed
    1. Arellano JI, Benavides-Piccione R, DeFelipe J, Rafael Yuste R. Ultrastructure of dendritic spines: correlation between synaptic and spine morphologies. Front Neurosci. 2007;1:131–143. - PMC - PubMed
    1. Arellano JI, Espinosa A, Fairén A, Yuste R, DeFelipe J. Non-synaptic dendritic spines in neocortex. Neuroscience. 2007;145:464–469. - PubMed
    1. Ballesteros-Yáñez I, Benavides-Piccione R, Bourgeois JP, Changeux JP, DeFelipe J. Alterations of cortical pyramidal neurons in mice lacking high-affinity nicotinic receptors. Proc Natl Acad Sci USA. 2010;107:11567–11572. - PMC - PubMed

Publication types