

Recent trends in healthcare utilization among children and adolescents with hypertension in the United States
- PMID: 22710648
- PMCID: PMC3808838
- DOI: 10.1161/HYPERTENSIONAHA.111.188813
Recent trends in healthcare utilization among children and adolescents with hypertension in the United States
Abstract
The objective of this study was to evaluate the healthcare utilization of hospitalized children with hypertension. The Healthcare Cost and Utilization Project Kids' Inpatient Database, years 1997, 2000, 2003, and 2006, was used to identify hypertension hospitalizations. We examined the association of patient and hospital characteristics on hypertension charges. Data from each cohort year were used to analyze trends in charges. We found that 71282 pediatric hypertension hospitalizations generated $3.1 billion in total charges from 1997 to 2006. Approximately 68% were 10 to 18 years old, 55% were boys, and 47% were white. Six percent of claims with a diagnosis code for hypertension also had a diagnosis code for end-stage renal disease or renal transplant. The frequency of hypertension discharges increased over time (P=0.02 for each of age groups 2-9 years and 2-18 years; P=0.03 for age group 10-18 years), as well as the fraction of inpatient charges attributed to hypertension (P<0.0001). Length of stay and end-stage renal disease were associated with increases in hospitalization associated charges (P<0.0001 and P=0.03, respectively). During the 10-year study period, the frequency of hypertension-associated hospitalizations was increasing across all of the age groups, and the fraction of charges related to hypertension was also increasing. The coexisting condition of end-stage renal disease resulted in a significant increase in healthcare charges.
Figures
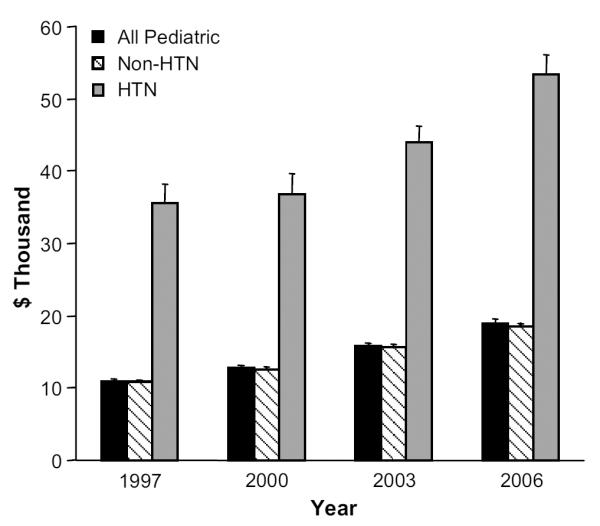
 , Nonhypertension (HTN);
  , HTN.
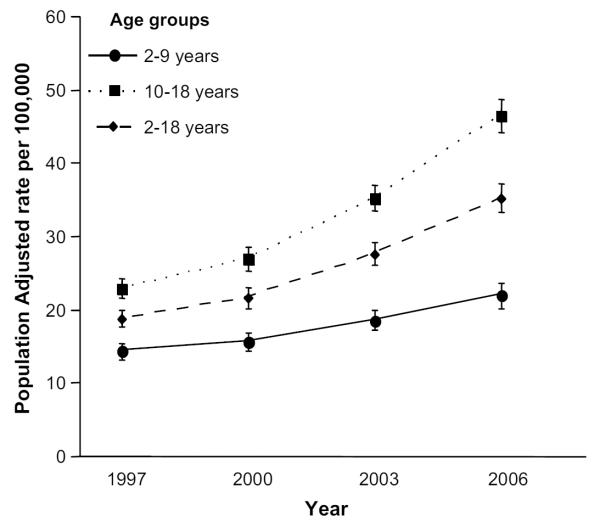
Comment in
-
The increasing burden of pediatric hypertension.Hypertension. 2012 Aug;60(2):276-7. doi: 10.1161/HYPERTENSIONAHA.112.197624. Epub 2012 Jun 18. Hypertension. 2012. PMID: 22710647 No abstract available.
References
-
- Ostchega Y, Carroll M, Prineas RJ, McDowell MA, Louis T, Tilert T. Trends of elevated blood pressure among children and adolescents: data from the national health and nutrition examination survey 1988–2006. Am J Hypertens. 2009;22:59–67. - PubMed
-
- Falkner B, Daniels SR. Summary of the fourth report on the diagnosis, evaluation, and treatment of high blood pressure in children and adolescents. Hypertension. 2004;44:387–388. - PubMed
-
- McNiece KL, Poffenbarger TS, Turner JL, Franco KD, Sorof JM, Portman RJ. Prevalence of hypertension and pre-hypertension among adolescents. J Pediatr. 2007;150:640–644. 644, e641. - PubMed
-
- Flynn JT. Pediatric hypertension: recent trends and accomplishments, future challenges. Am J Hypertens. 2008;21:605–612. - PubMed
-
- Lauer RM, Clarke WR. Childhood risk factors for high adult blood pressure: the Muscatine Study. Pediatrics. 1989;84:633–641. - PubMed
Publication types
MeSH terms
Grants and funding
LinkOut - more resources
Full Text Sources
Medical
