Genetic architecture of resilience of executive functioning
- PMID: 22711244
- PMCID: PMC3607298
- DOI: 10.1007/s11682-012-9184-1
Genetic architecture of resilience of executive functioning
Abstract
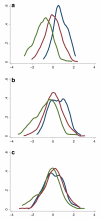
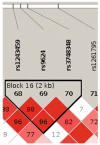
The genetic basis of resilience, defined as better cognitive functioning than predicted based on neuroimaging or neuropathology, is not well understood. Our objective was to identify genetic variation associated with executive functioning resilience. We computed residuals from regression models of executive functioning, adjusting for age, sex, education, Hachinski score, and MRI findings (lacunes, cortical thickness, volumes of white matter hyperintensities and hippocampus). We estimated heritability and analyzed these residuals in models for each SNP. We further evaluated our most promising SNP result by evaluating cis-associations with brain levels of nearby (±100 kb) genes from a companion data set, and comparing expression levels in cortex and cerebellum from decedents with AD with those from other non-AD diseases. Complete data were available for 750 ADNI participants of European descent. Executive functioning resilience was highly heritable (H² = 0.76; S.E. = 0.44). rs3748348 on chromosome 14 in the region of RNASE13 was associated with executive functioning resilience (p-value = 4.31 × 10⁻⁷). rs3748348 is in strong linkage disequilibrium (D' of 1.00 and 0.96) with SNPs that map to TPPP2, a member of the α-synuclein family of proteins. We identified nominally significant associations between rs3748348 and expression levels of three genes (FLJ10357, RNASE2, and NDRG2). The strongest association was for FLJ10357 in cortex, which also had the most significant difference in expression between AD and non-AD brains, with greater expression in cortex of decedents with AD (p-value = 7 × 10⁻⁷). Further research is warranted to determine whether this signal can be replicated and whether other loci may be associated with cognitive resilience.
Figures


References
-
- Barrett JC, Fry B, Maller J, Daly MJ. Haploview: analysis and visualization of LD and haplotype maps. Bioinformatics. 2005;21(2):263–265. doi:10.1093/bioinformatics/bth457. - PubMed
-
- Centers for Disease Control and Prevention. Alzheimer’s Association . The healthy brain initiative: a national public health road map to maintaining cognitive health. Alzheimer’s Association; Chicago: 2007.
Publication types
MeSH terms
Grants and funding
- K01 AG030514/AG/NIA NIH HHS/United States
- R01 AG019771/AG/NIA NIH HHS/United States
- P50 AG05136/AG/NIA NIH HHS/United States
- P30 AG10133/AG/NIA NIH HHS/United States
- P30 AG010133/AG/NIA NIH HHS/United States
- CAPMC/ CIHR/Canada
- P30 AG013846/AG/NIA NIH HHS/United States
- P50 AG005136/AG/NIA NIH HHS/United States
- R01 AG029672/AG/NIA NIH HHS/United States
- R01 AG032990/AG/NIA NIH HHS/United States
- R01 AG19771/AG/NIA NIH HHS/United States
- P30 AG010129/AG/NIA NIH HHS/United States
- P30 AG019610/AG/NIA NIH HHS/United States
- R13 AG030995/AG/NIA NIH HHS/United States
- P50 AG016574/AG/NIA NIH HHS/United States
- K99 LM011384/LM/NLM NIH HHS/United States
- U01 AG024904/AG/NIA NIH HHS/United States
- U19 AG010483/AG/NIA NIH HHS/United States

