. 2012 Jul 24;126(4):455-67.
doi: 10.1161/CIRCULATIONAHA.112.103176. Epub 2012 Jun 18.

Histone deacetylation inhibition in pulmonary hypertension: therapeutic potential of valproic acid and suberoylanilide hydroxamic acid

Affiliations

Histone deacetylation inhibition in pulmonary hypertension: therapeutic potential of valproic acid and suberoylanilide hydroxamic acid

Lan Zhao et al. Circulation. .

Abstract

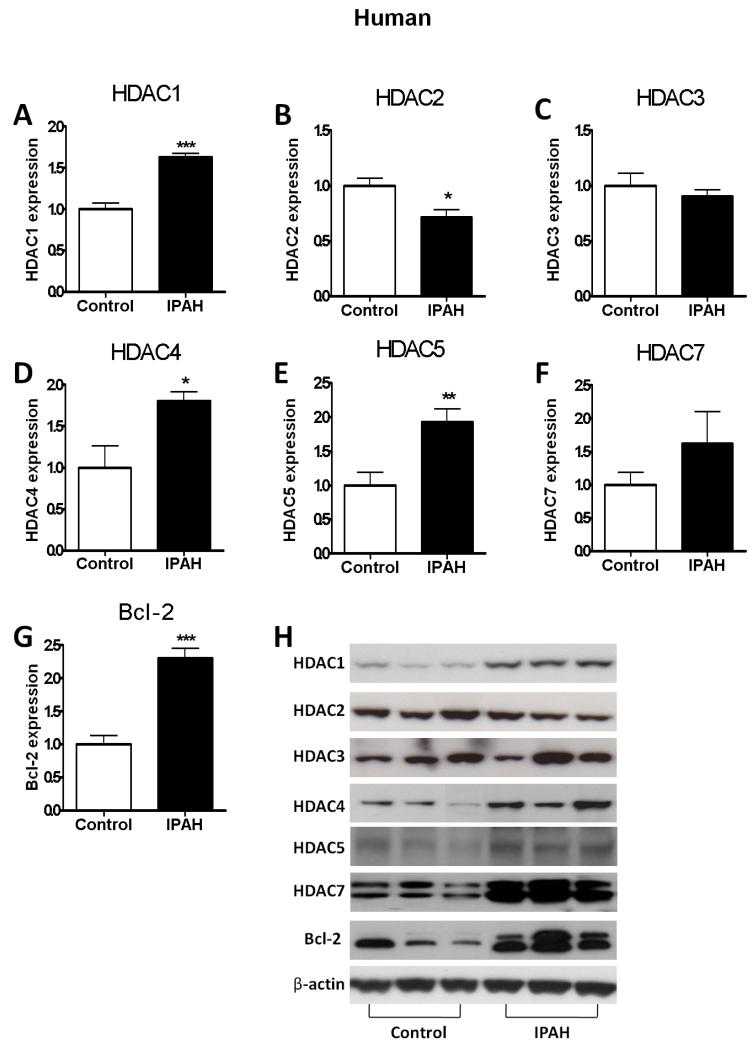
Background: Epigenetic programming, dynamically regulated by histone acetylation, is a key mechanism regulating cell proliferation and survival. Little is known about the contribution of histone deacetylase (HDAC) activity to the development of pulmonary arterial hypertension, a condition characterized by profound structural remodeling of pulmonary arteries and arterioles.

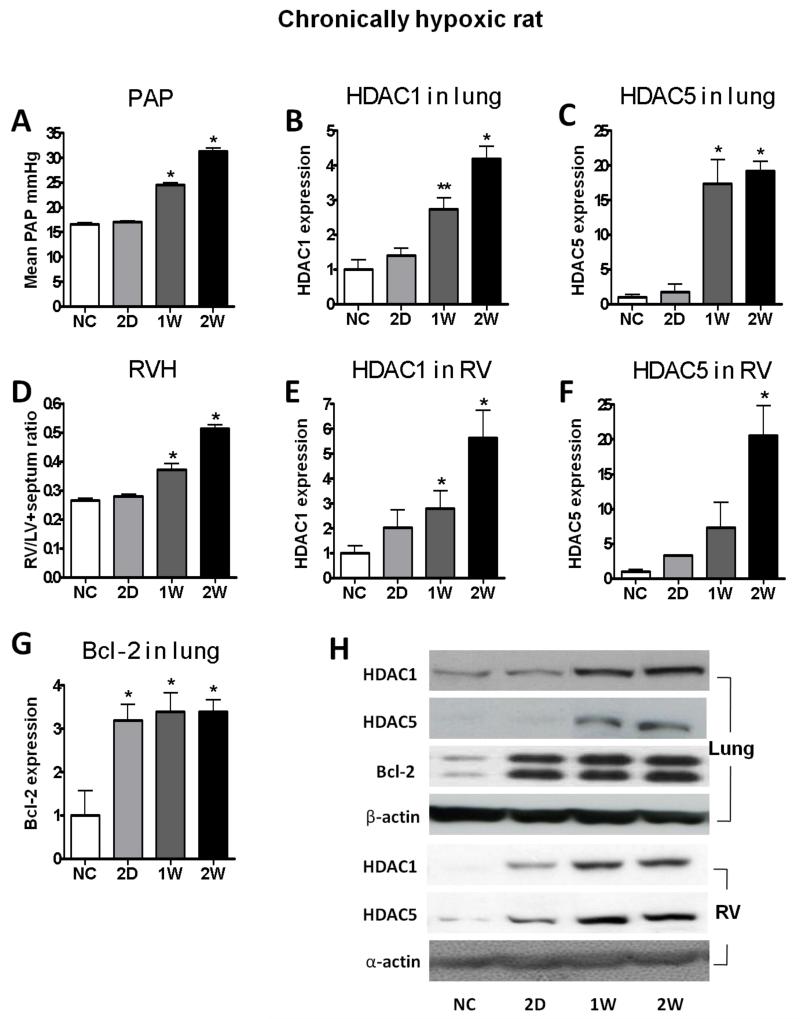
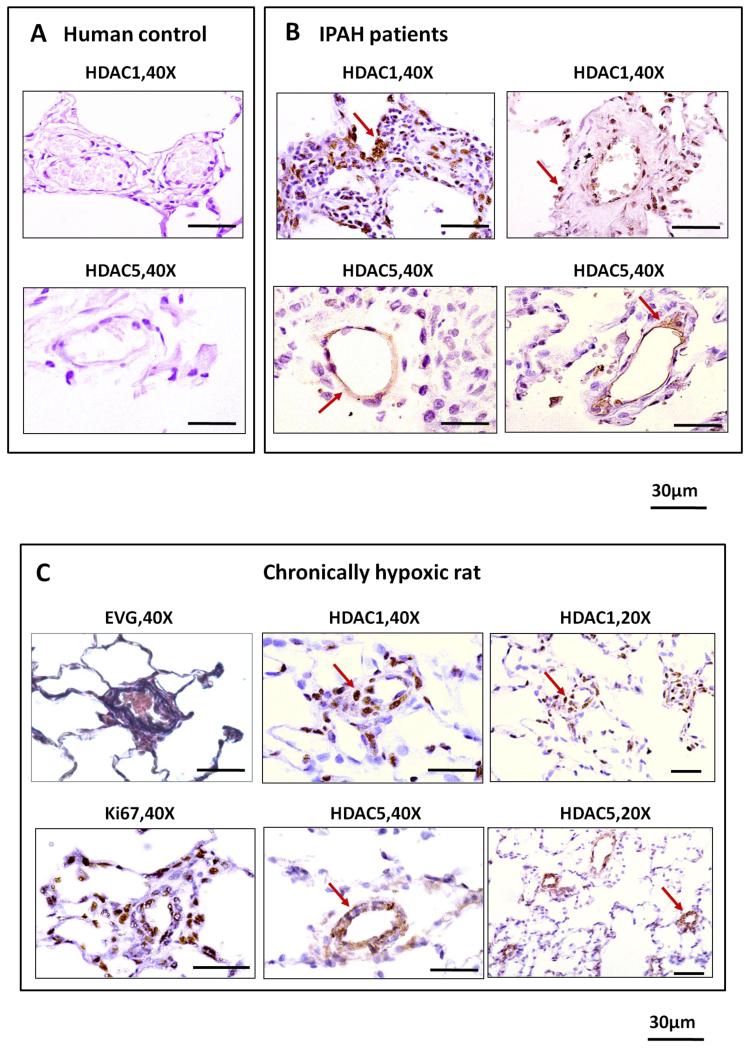
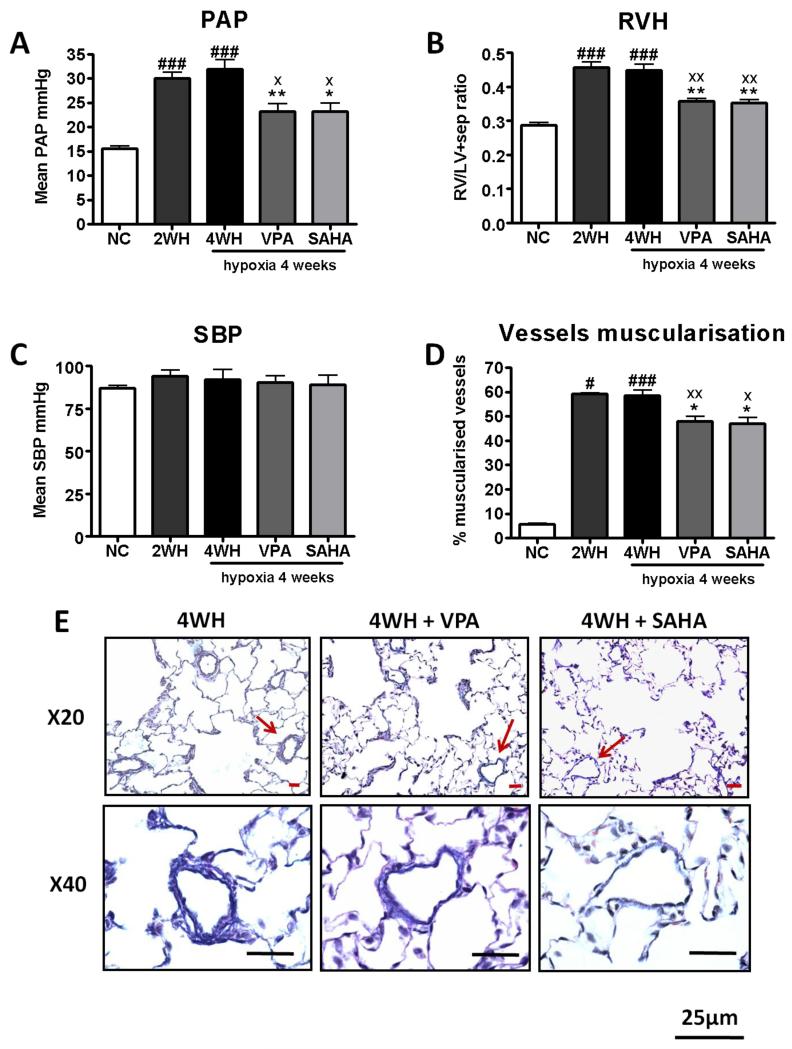
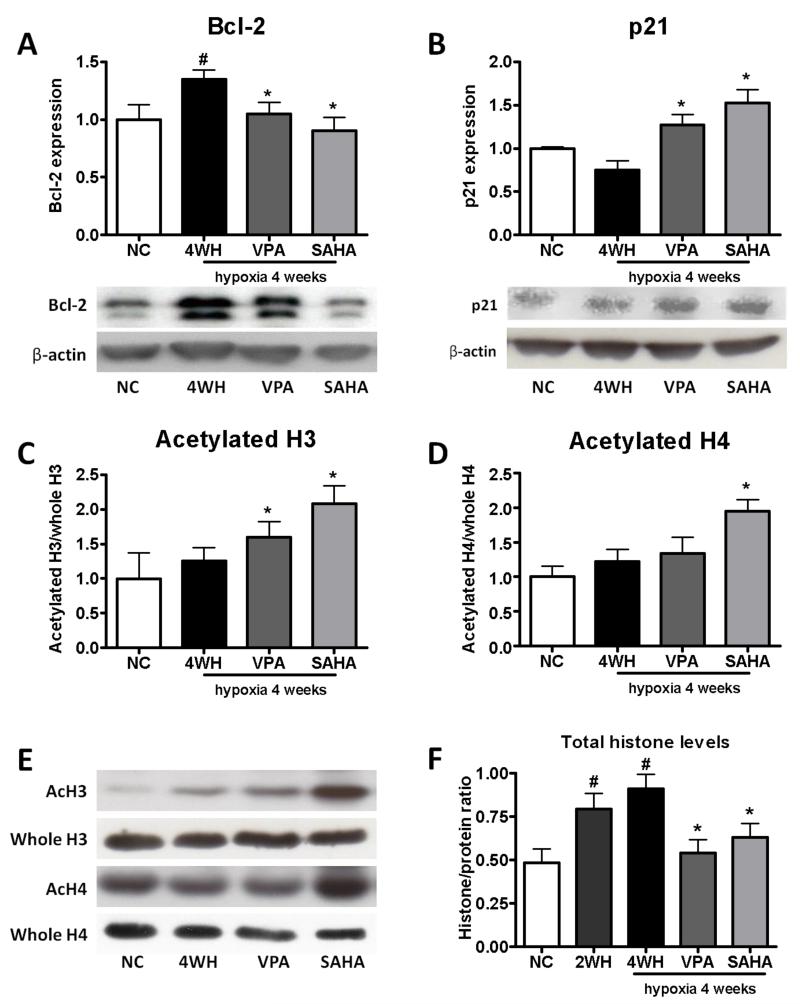
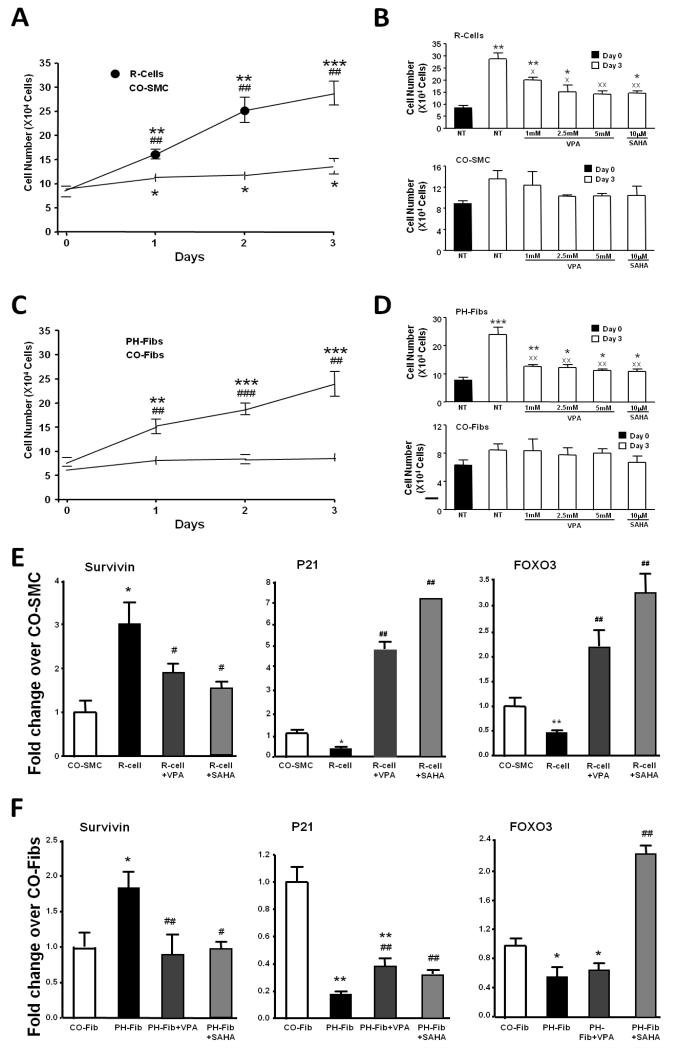
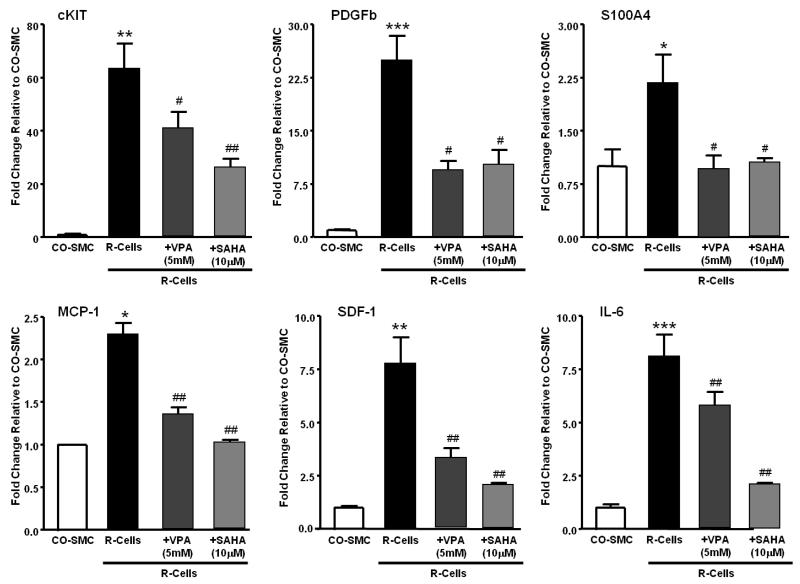
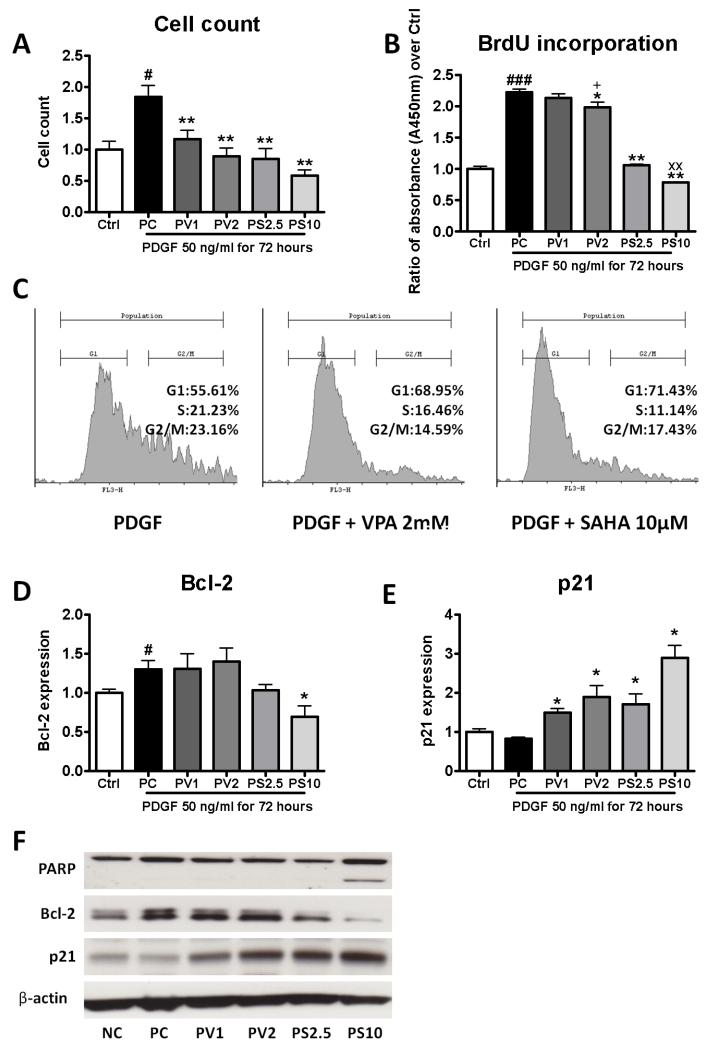
Methods and results: HDAC1 and HDAC5 protein levels were elevated in lungs from human idiopathic pulmonary arterial hypertension and in lungs and right ventricles from rats exposed to hypoxia. Immunohistochemistry localized increased expression to remodeled vessels in the lung. Both valproic acid, a class I HDAC inhibitor, and suberoylanilide hydroxamic acid (vorinostat), an inhibitor of class I, II, and IV HDACs, mitigated the development of and reduced established hypoxia-induced pulmonary hypertension in the rat. Both valproic acid and suberoylanilide hydroxamic acid inhibited the imprinted highly proliferative phenotype of fibroblasts and R-cells from pulmonary hypertensive bovine vessels and platelet-derived growth factor-stimulated growth of human vascular smooth muscle cells in culture. Exposure to valproic acid and suberoylanilide hydroxamic acid was associated with increased levels of p21 and FOXO3 and reduced expression of survivin. The significantly higher levels of expression of cKIT, monocyte chemoattractant protein-1, interleukin-6, stromal-derived factor-1, platelet-derived growth factor-b, and S100A4 in R-cells were downregulated by valproic acid and suberoylanilide hydroxamic acid treatment.

Conclusions: Increased HDAC activity contributes to the vascular pathology of pulmonary hypertension. The effectiveness of HDAC inhibitors, valproic acid, and suberoylanilide hydroxamic acid, in models of pulmonary arterial hypertension supports a therapeutic strategy based on HDAC inhibition in pulmonary arterial hypertension.


Figures

Figure 1
Figure 1
HDAC protein expression levels in human lung extracts from IPAH patients (n=12) and lobectomy (control, n=21). (A) HDAC1, (B) HDAC2, (C) HDAC3, (D) HDAC4, (E) HDAC5, (F) HDAC7 (G) Bcl-2, and (H) representative bands. The data are generated from optical density measurements of individual bands from Western blots and normalised to β-actin. The ratios are presented as mean ± SEM of fold change relative to control. * p<0.05, ** p<0.005, *** p<0.0001 compared with control group.
Figure 2
Figure 2
Time course of development of pulmonary hypertension phenotype and HDAC expression in chronically hypoxic rat. (A) PAP, mean pulmonary arterial pressure, (B) HDAC1 in lung, (C) HDAC5 in lung, (D) RVH, RV hypertrophy, (E) HDAC1 in RV, (F) HDAC5 in RV, (G) Bcl-2 in lung, and (H) representative bands. Rats were exposed to normal air (NC) or hypoxia for 2 days (2D), 1 week (1W) and 2 weeks (2W). The data are generated from optical density measurements of individual bands from Western blots and normalised to β-actin. The ratios are presented as mean ± SEM of fold change relative to control (normal air). n≥3 for each group. * p<0.05, ** p<0.005 compared with NC group.
Figure 3
Figure 3
Immunohistochemistry of HDAC1 and HDAC5 in human and rat lungs. (A) Both HDAC1 and HDAC5 exhibit relatively weak expression in control lobectomy lung sections. (B) HDAC1 exhibits predominantly nuclear distribution in perivascular and vascular cells of remodelled vessels while HDAC5 is seen mainly in cytoplasm in IPAH lung sections. (C) Prominent HDAC1 and Ki67 expression in nuclei of perivascular and vascular cells while HDAC5 has a cytoplasmic distribution in vascular cells of remodelled vessels in lung sections from rats exposed to hypoxia for 4 weeks.
Figure 4
Figure 4
Treatment of established hypoxia-induced pulmonary hypertension. Valproic acid or SAHA administered during the last 2 weeks of 4 week hypoxia exposure. (n≥6 for each group). (A) Mean pulmonary artery pressure, PAP, (B) right ventricular hypertrophy, RV/LV+sep, (C) systolic blood pressure, SBP, (D) percentage of muscularised vessels, and (E) Elastic van Gieson. NC: normoxia; 2WH: hypoxia for 2 weeks; 4WH: hypoxia for 4 weeks; VPA: hypoxia with VPA 300 mg/kg/day, and SAHA: hypoxia with SAHA 50 mg/kg/day. The data are presented as mean± SEM. n≥6 for each group. * p<0.05, ** p<0.005 compared with 4WH. x p<0.05, xx p<0.005 compared with 2WH, # p<0.05, ## p<0.05, ### p<0.0005 compared with NC.
Figure 5
Figure 5
Expression of Bcl-2, p21 and acetylated histone levels in rat lung extracts from chronic hypoxia treatment study. (A) Bcl-2, (B) p21, (C) acetylated H3, (D) acetylated H4, (E) representative blots, (F) total histone levels. The data are generated from optical density measurements of individual bands from Western blots. Bcl-2 and p21 protein expression is normalised to β-actin, acetlyated histone to total hisotne, and total histone levels to total protein level. Data are presented as mean ± SEM of fold change relative to NC. n=6. NC: normoxia; 4WH: hypoxia for 4 weeks; VPA: hypoxia with VPA 300 mg/kg/day; SAHA: hypoxia with SAHA 50 mg/kg/day. * p<0.05 compared with 4WH, # p<0.05 compared with NC.
Figure 6
Figure 6
Effects of histone deacetylase inhibition on bovine R-cells and fibroblasts PH-Fibs in culture. Effects on proliferation are assessed by counting: (A) Daily cell counts of serum deprived R-cells and control smooth muscle cells (CO-SMC) in 3 days, (B) Cell counts of R-cells and CO-SMC, untreated and treated with increasing concentrations of VPA (1mM, 2.5mM, and 5mM), SAHA (10μM) for 3 days, (C) Daily cell counts of serum deprived PH-Fibs and control fibroblasts (CO-Fibs) in 3 days, (D) Cell counts of PH-Fibs and CO-Fibs, untreated and treated with increasing concentrations of VPA (1mM, 2.5mM, and 5mM), SAHA (10μM) for 3 days. The data are presented as mean ± SEM of cell numbers. NT: untreated. * p<0.05, ** p<0.01, *** p<0.001 compared with day 0 within the same cell type, ## p<0.01, ### p<0.001 compared with CO-SMC or CO-Fibs on the same day, x p<0.05, xx p<0.01 compared with untreated on day 3. Effects of VPA (5mM) and SAHA (10μM) for 24 hours on gene expression are assessed by RT-PCR: (E) mRNA expression of genes involved in the cell cycle and apoptosis, including survivin, p21 and FOXO3. The data are presented as mean ± SEM of fold change to either CO-SMC or CO-Fibs. * p<0.05, ** p<0.01 compared with CO-SMC or CO-Fibs, #, p<0.05, ## p<0.01 compared with untreated R-cells or PH-Fibs.
Figure 7
Figure 7
Effects of VPA (5mM) and SAHA (10μM) on gene expression of growth factor (cKIT, PDGFb, S100A4) and pro-inflammatory factor (MCP-1, SDF-1, IL-6) in serum deprived R-cells. Cells were untreated or treated with VPA (5mM) for 24 hours and mRNA expression is analysed by RT-PCT. The data are presentes as mean ± SEM of fold change to either CO-SMC. * p<0.05, ** p<0.01 *** p<0.001 compared with CO-SMC, #, p<0.05, ## p<0.01 compared with untreated R-cells.
Figure 8
Figure 8
Effect of histone deacetylase inhibition on PDGF-stimulated human pulmonary smooth muscle cells in culture. (A) cell counts; (B) BrdU incorporation assay; (C) FACS analysis for cell cycle distribution showing both VPA and SAHA arrested cell growth at G1-S phase; (D) p21 and (E) Bcl-2 protein expression. (F) PARP cleavage. Data are presented as mean ± SEM of fold change relative to control (Ctrl). Each experiment was repeated at least 3 times with separate cell preparations. Ctrl: control, PC: PDGF, PV1: PDGF+VPA 1mM, PV2: PDGF+VPA 2mM, PS2.5: PDGF+SAHA 2.5μM, PS10: PDGF+SAHA 10μM. * p<0.05, ** p<0.005 compared with PC, xx p<0.005 compared with PS2.5, + p<0.05 compared with PV1, # p<0.05, ### p<0.0005 compared with Ctrl.

Comment in

Similar articles

Cited by

References

    1. Hassoun PM, Mouthon L, Barbera JA, Eddahibi S, Flores SC, Grimminger F, Jones PL, Maitland ML, Michelakis ED, Morrell NW, Newman JH, Rabinovitch M, Schermuly R, Stenmark KR, Voelkel NF, Yuan JX, Humbert M. Inflammation, growth factors, and pulmonary vascular remodeling. J Am Coll Cardiol. 2009;54:S10–S19. - PubMed
    1. Tuder RM, Abman SH, Braun T, Capron F, Stevens T, Thistlethwaite PA, Haworth SG. Development and pathology of pulmonary hypertension. J Am Coll Cardiol. 2009;54:S3–S9. - PubMed
    1. Archer SL, Weir EK, Wilkins MR. Basic science of pulmonary arterial hypertension for clinicians: new concepts and experimental therapies. Circulation. 2010;121:2045–2066. - PMC - PubMed
    1. Eberharter A, Becker PB. Histone acetylation: a switch between repressive and permissive chromatin. Second in review series on chromatin dynamics. EMBO Rep. 2002;3:224–229. - PMC - PubMed
    1. Richards EJ, Elgin SC. Epigenetic codes for heterochromatin formation and silencing: rounding up the usual suspects. Cell. 2002;108:489–500. - PubMed

Publication types

MeSH terms