Aberrant functional network recruitment of posterior parietal cortex in Turner syndrome
- PMID: 22711287
- PMCID: PMC4360970
- DOI: 10.1002/hbm.22131
Aberrant functional network recruitment of posterior parietal cortex in Turner syndrome
Abstract
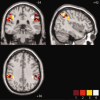
Turner syndrome is a genetic disorder caused by the complete or partial absence of an X chromosome in affected women. Individuals with TS show characteristic difficulties with executive functions, visual-spatial and mathematical cognition, with relatively intact verbal skills, and congruent abnormalities in structural development of the posterior parietal cortex (PPC). The functionally heterogeneous PPC has recently been investigated using connectivity-based clustering methods, which sub-divide a given region into clusters of voxels showing similar structural or functional connectivity to other brain regions. In the present study, we extended this method to compare connectivity-based clustering between groups and investigate whether functional networks differentially recruit the PPC in TS. To this end, we parcellated the PPC into sub-regions based on temporal correlations with other regions of the brain. fMRI data were collected from 15 girls with TS and 14 typically developing (TD) girls, aged 7-14, while they performed a visual-spatial task. Temporal correlations between voxels in the PPC and a set of seed regions were calculated, and the PPC divided into clusters of voxels showing similar connectivity. It was found that in general the PPC parcellates similarly in TS and TD girls, but that regions in bilateral inferior parietal lobules, and posterior right superior parietal lobule, were reliably recruited by different networks in TS relative to TD participants. These regions showed weaker correlation in TS with a set of regions involved in visual processing. These results suggest that abnormal development of visuospatial functional networks in TS may relate to the well documented cognitive difficulties in this disorder.
Keywords: Turner syndrome; functional connectivity; posterior parietal.
Copyright © 2012 Wiley Periodicals, Inc.
Figures


Similar articles
-
Aberrant parietal cortex developmental trajectories in girls with Turner syndrome and related visual-spatial cognitive development: a preliminary study.Am J Med Genet B Neuropsychiatr Genet. 2014 Sep;165B(6):531-40. doi: 10.1002/ajmg.b.32256. Epub 2014 Jul 11. Am J Med Genet B Neuropsychiatr Genet. 2014. PMID: 25044604 Free PMC article.
-
Reduced functional connectivity during working memory in Turner syndrome.Cereb Cortex. 2011 Nov;21(11):2471-81. doi: 10.1093/cercor/bhr017. Epub 2011 Mar 25. Cereb Cortex. 2011. PMID: 21441396 Free PMC article.
-
Altered resting-state frontoparietal control network in children with attention-deficit/hyperactivity disorder.J Int Neuropsychol Soc. 2015 Apr;21(4):271-84. doi: 10.1017/S135561771500020X. Epub 2015 Apr 30. J Int Neuropsychol Soc. 2015. PMID: 25928822
-
Cognition and behavior in Turner syndrome: a brief review.Pediatr Endocrinol Rev. 2012 May;9 Suppl 2(0 2):710-2. Pediatr Endocrinol Rev. 2012. PMID: 22946281 Free PMC article. Review.
-
Cerebral laterality in Turner syndrome: a critical review of the literature.Child Neuropsychol. 2008 Mar;14(2):135-47. doi: 10.1080/09297040701346099. Child Neuropsychol. 2008. PMID: 17943479 Review.
Cited by
-
Typical and atypical brain development: a review of neuroimaging studies.Dialogues Clin Neurosci. 2013 Sep;15(3):359-84. doi: 10.31887/DCNS.2013.15.3/edennis. Dialogues Clin Neurosci. 2013. PMID: 24174907 Free PMC article. Review.
-
Functional network integration and attention skills in young children.Dev Cogn Neurosci. 2018 Apr;30:200-211. doi: 10.1016/j.dcn.2018.03.007. Epub 2018 Mar 20. Dev Cogn Neurosci. 2018. PMID: 29587178 Free PMC article.
-
Individual Differences in Adult Reading Are Associated with Left Temporo-parietal to Dorsal Striatal Functional Connectivity.Cereb Cortex. 2016 Oct;26(10):4069-4081. doi: 10.1093/cercor/bhv214. Epub 2015 Sep 22. Cereb Cortex. 2016. PMID: 26400921 Free PMC article.
-
Aberrant parietal cortex developmental trajectories in girls with Turner syndrome and related visual-spatial cognitive development: a preliminary study.Am J Med Genet B Neuropsychiatr Genet. 2014 Sep;165B(6):531-40. doi: 10.1002/ajmg.b.32256. Epub 2014 Jul 11. Am J Med Genet B Neuropsychiatr Genet. 2014. PMID: 25044604 Free PMC article.
-
Variation in functional connectivity along anterior-to-posterior intraparietal sulcus, and relationship with age across late childhood and adolescence.Dev Cogn Neurosci. 2015 Jun;13:32-42. doi: 10.1016/j.dcn.2015.04.004. Epub 2015 Apr 21. Dev Cogn Neurosci. 2015. PMID: 25951196 Free PMC article.
References
-
- Benton AL, Varney NR, Hamsher KD (1978): Visuospatial judgment. A clinical test. Arch Neurol 35:364–367. - PubMed
Publication types
MeSH terms
Substances
Grants and funding
LinkOut - more resources
Full Text Sources
Medical

