Counteracting effects operating on Src homology 2 domain-containing protein-tyrosine phosphatase 2 (SHP2) function drive selection of the recurrent Y62D and Y63C substitutions in Noonan syndrome
- PMID: 22711529
- PMCID: PMC3411048
- DOI: 10.1074/jbc.M112.350231
Counteracting effects operating on Src homology 2 domain-containing protein-tyrosine phosphatase 2 (SHP2) function drive selection of the recurrent Y62D and Y63C substitutions in Noonan syndrome
Abstract
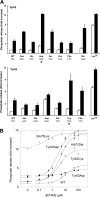
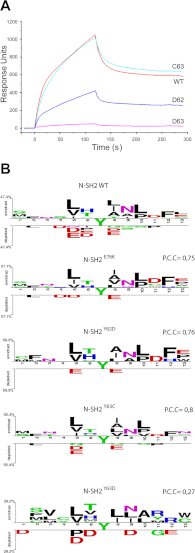
Activating mutations in PTPN11 cause Noonan syndrome, the most common nonchromosomal disorder affecting development and growth. PTPN11 encodes SHP2, an Src homology 2 (SH2) domain-containing protein-tyrosine phosphatase that positively modulates RAS function. Here, we characterized functionally all possible amino acid substitutions arising from single-base changes affecting codons 62 and 63 to explore the molecular mechanisms lying behind the largely invariant occurrence of the Y62D and Y63C substitutions recurring in Noonan syndrome. We provide structural and biochemical data indicating that the autoinhibitory interaction between the N-SH2 and protein-tyrosine phosphatase (PTP) domains is perturbed in both mutants as a result of an extensive structural rearrangement of the N-SH2 domain. Most mutations affecting Tyr(63) exerted an unpredicted disrupting effect on the structure of the N-SH2 phosphopeptide-binding cleft mediating the interaction of SHP2 with signaling partners. Among all the amino acid changes affecting that codon, the disease-causing mutation was the only substitution that perturbed the stability of the inactive conformation of SHP2 without severely impairing proper phosphopeptide binding of N-SH2. On the other hand, the disruptive effect of the Y62D change on the autoinhibited conformation of the protein was balanced, in part, by less efficient binding properties of the mutant. Overall, our data demonstrate that the selection-by-function mechanism acting as driving force for PTPN11 mutations affecting codons 62 and 63 implies balancing of counteracting effects operating on the allosteric control of the function of SHP2.
Figures


Similar articles
-
Protein tyrosine phosphatase SHP2/PTPN11 mistargeting as a consequence of SH2-domain point mutations associated with Noonan Syndrome and leukemia.J Proteomics. 2013 Jun 12;84:132-47. doi: 10.1016/j.jprot.2013.04.005. Epub 2013 Apr 11. J Proteomics. 2013. PMID: 23584145
-
Structural, Functional, and Clinical Characterization of a Novel PTPN11 Mutation Cluster Underlying Noonan Syndrome.Hum Mutat. 2017 Apr;38(4):451-459. doi: 10.1002/humu.23175. Epub 2017 Feb 7. Hum Mutat. 2017. PMID: 28074573
-
Diverse driving forces underlie the invariant occurrence of the T42A, E139D, I282V and T468M SHP2 amino acid substitutions causing Noonan and LEOPARD syndromes.Hum Mol Genet. 2008 Jul 1;17(13):2018-29. doi: 10.1093/hmg/ddn099. Epub 2008 Mar 27. Hum Mol Genet. 2008. PMID: 18372317 Free PMC article.
-
Structure, function, and pathogenesis of SHP2 in developmental disorders and tumorigenesis.Curr Cancer Drug Targets. 2014;14(6):567-88. doi: 10.2174/1568009614666140717105001. Curr Cancer Drug Targets. 2014. PMID: 25039348 Review.
-
SHP2 sails from physiology to pathology.Eur J Med Genet. 2015 Oct;58(10):509-25. doi: 10.1016/j.ejmg.2015.08.005. Epub 2015 Sep 2. Eur J Med Genet. 2015. PMID: 26341048 Review.
Cited by
-
Heterogeneity in Lowe Syndrome: Mutations Affecting the Phosphatase Domain of OCRL1 Differ in Impact on Enzymatic Activity and Severity of Cellular Phenotypes.Biomolecules. 2023 Mar 29;13(4):615. doi: 10.3390/biom13040615. Biomolecules. 2023. PMID: 37189363 Free PMC article.
-
Atomistic ensemble of active SHP2 phosphatase.Commun Biol. 2023 Dec 21;6(1):1289. doi: 10.1038/s42003-023-05682-5. Commun Biol. 2023. PMID: 38129686 Free PMC article.
-
Targeting Oncogenic Src Homology 2 Domain-Containing Phosphatase 2 (SHP2) by Inhibiting Its Protein-Protein Interactions.J Med Chem. 2021 Nov 11;64(21):15973-15990. doi: 10.1021/acs.jmedchem.1c01371. Epub 2021 Oct 29. J Med Chem. 2021. PMID: 34714648 Free PMC article.
-
A Hotspot Phosphorylation Site on SHP2 Drives Oncoprotein Activation and Drug Resistance.bioRxiv [Preprint]. 2025 Jun 16:2025.06.11.659120. doi: 10.1101/2025.06.11.659120. bioRxiv. 2025. PMID: 40667115 Free PMC article. Preprint.
-
Germline selection of PTPN11 (HGNC:9644) variants make a major contribution to both Noonan syndrome's high birth rate and the transmission of sporadic cancer variants resulting in fetal abnormality.Hum Mutat. 2022 Dec;43(12):2205-2221. doi: 10.1002/humu.24493. Epub 2022 Nov 24. Hum Mutat. 2022. PMID: 36349709 Free PMC article.
References
-
- Tartaglia M., Mehler E. L., Goldberg R., Zampino G., Brunner H. G., Kremer H., van der Burgt I., Crosby A. H., Ion A., Jeffery S., Kalidas K., Patton M. A., Kucherlapati R. S., Gelb B. D. (2001) Mutations in PTPN11, encoding the protein-tyrosine phosphatase SHP-2, cause Noonan syndrome. Nat. Genet. 29, 465–468 - PubMed
-
- Allanson J. E. (2007) Noonan syndrome. Am. J. Med. Genet. C Semin. Med. Genet. 145C, 274–279 - PubMed
Publication types
MeSH terms
Substances
Grants and funding
LinkOut - more resources
Full Text Sources
Other Literature Sources
Miscellaneous

