. 2012 Jun 25;197(7):939-56.
doi: 10.1083/jcb.201111052. Epub 2012 Jun 18.

Arp2/3 complex-dependent actin networks constrain myosin II function in driving retrograde actin flow

Affiliations

Arp2/3 complex-dependent actin networks constrain myosin II function in driving retrograde actin flow

Qing Yang et al. J Cell Biol. .

Abstract

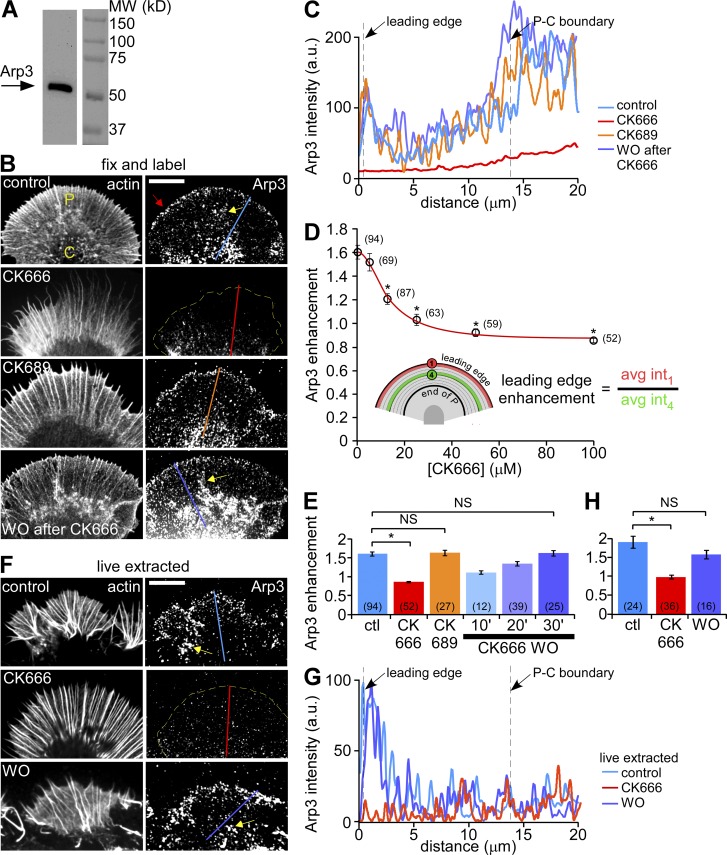
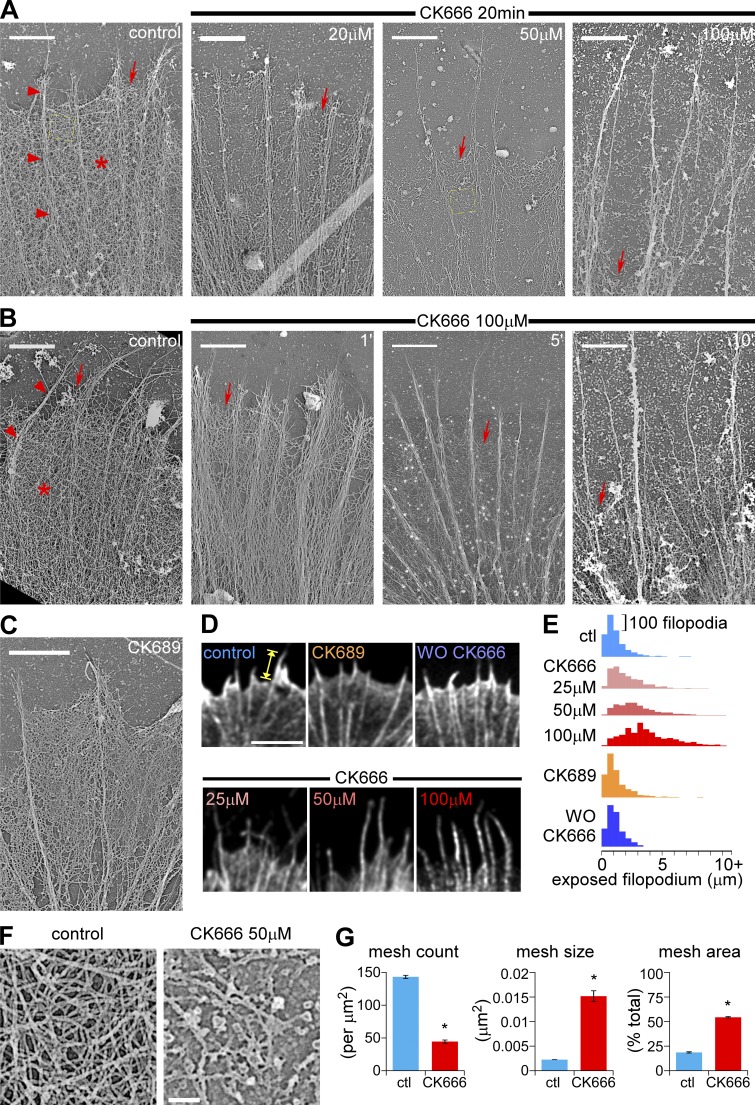
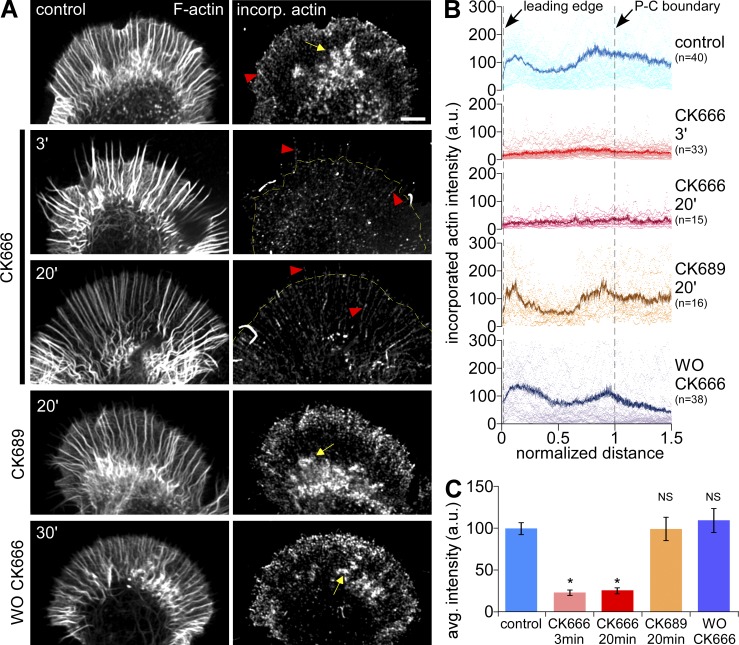
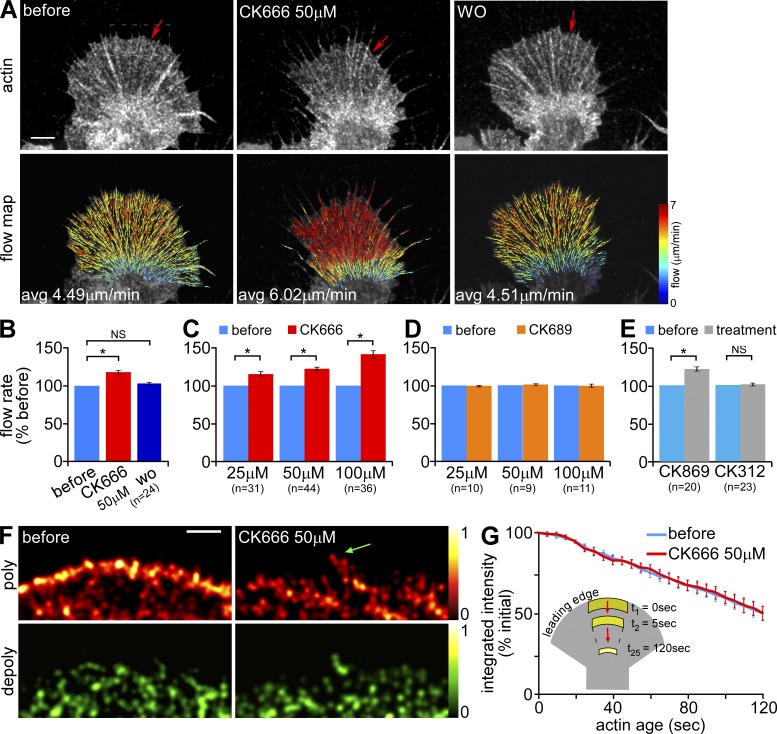
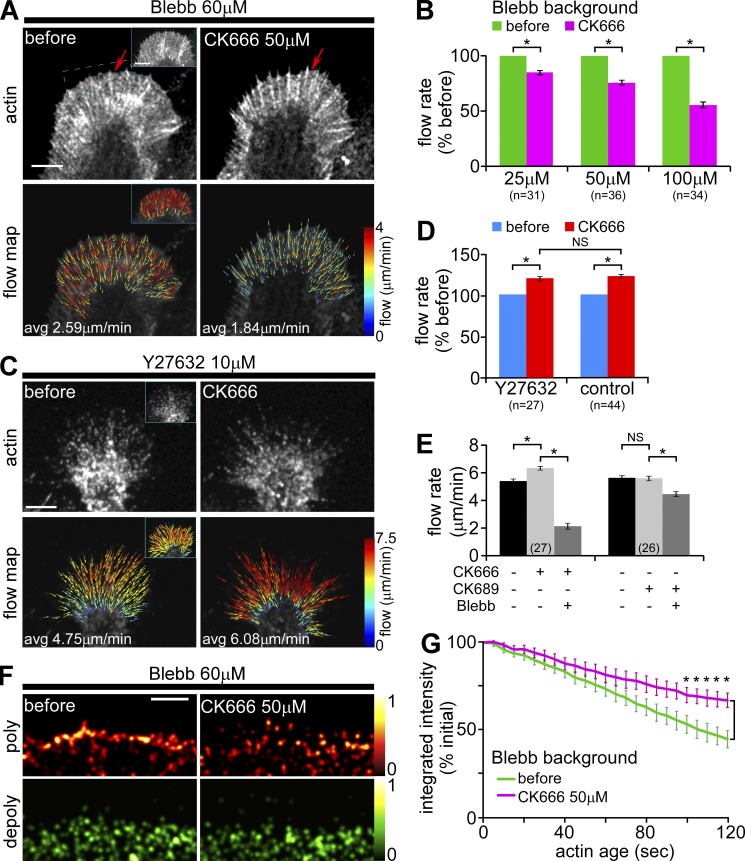
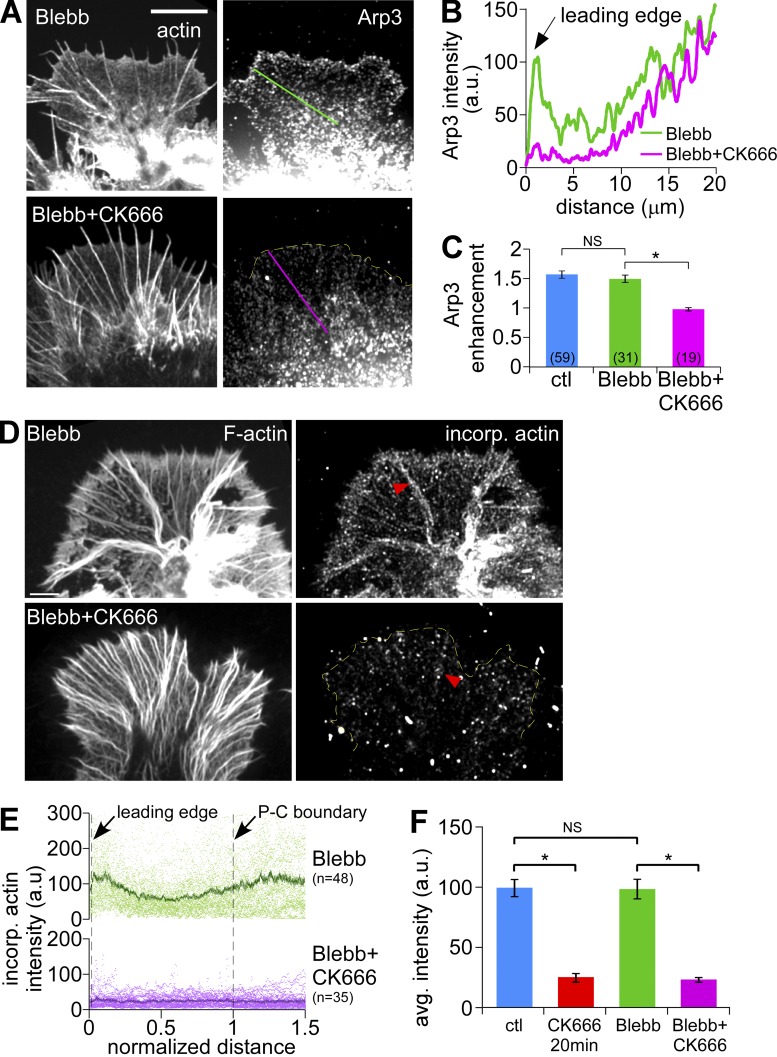
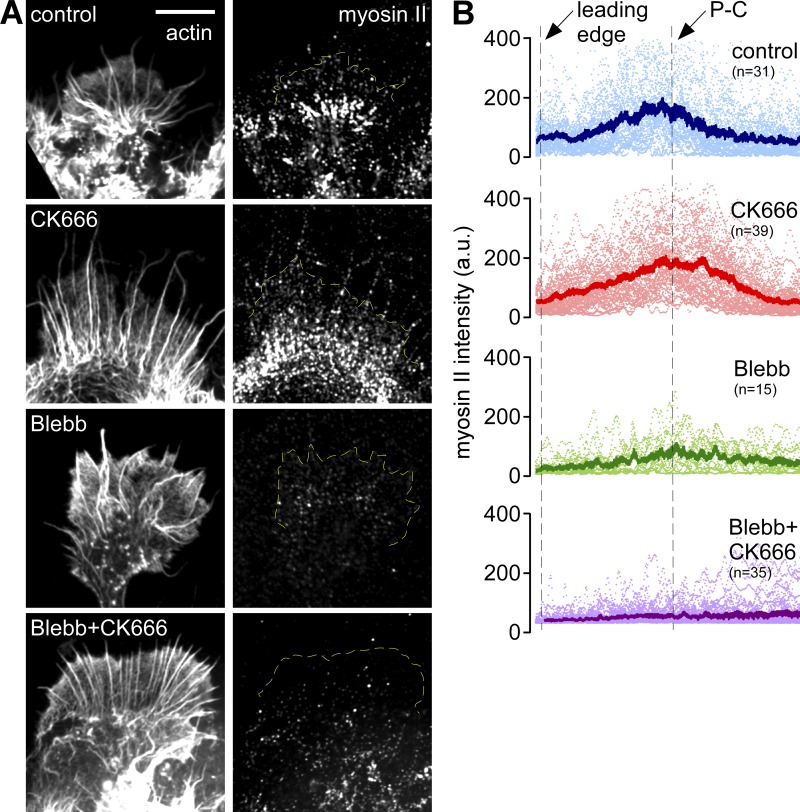
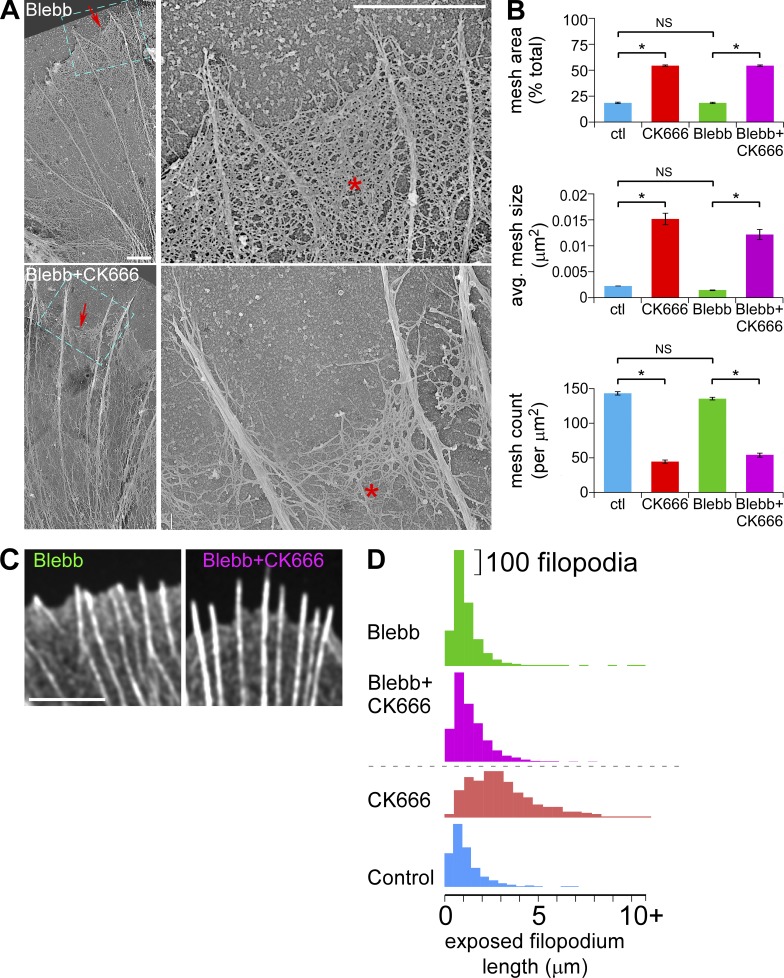
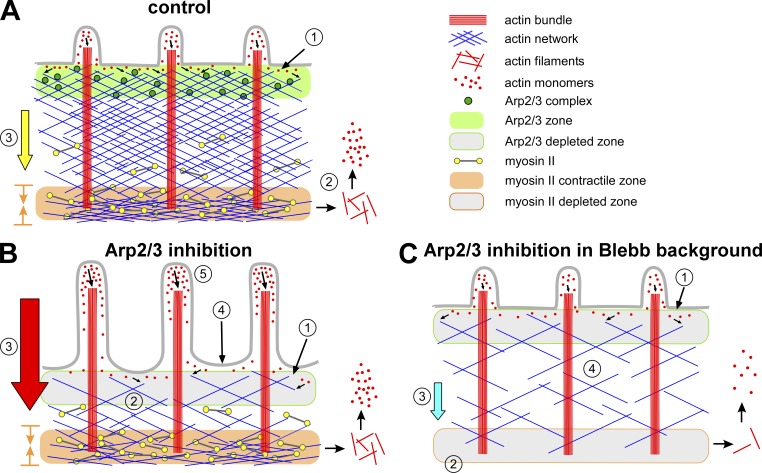
The Arp2/3 complex nucleates actin filaments to generate networks at the leading edge of motile cells. Nonmuscle myosin II produces contractile forces involved in driving actin network translocation. We inhibited the Arp2/3 complex and/or myosin II with small molecules to investigate their respective functions in neuronal growth cone actin dynamics. Inhibition of the Arp2/3 complex with CK666 reduced barbed end actin assembly site density at the leading edge, disrupted actin veils, and resulted in veil retraction. Strikingly, retrograde actin flow rates increased with Arp2/3 complex inhibition; however, when myosin II activity was blocked, Arp2/3 complex inhibition now resulted in slowing of retrograde actin flow and veils no longer retracted. Retrograde flow rate increases induced by Arp2/3 complex inhibition were independent of Rho kinase activity. These results provide evidence that, although the Arp2/3 complex and myosin II are spatially segregated, actin networks assembled by the Arp2/3 complex can restrict myosin II-dependent contractility with consequent effects on growth cone motility.


Figures

Figure 1.
Figure 1.
Arp2/3 complex inhibition disrupts its localization in growth cones. (A) Western blot analysis of Aplysia CNS proteins with anti-Arp3 antibody. (B) Fluorescent labeling of Aplysia bag cell neuron growth cones with Arp3 antibody and Alexa 594 phalloidin after normal fixation. Growth cones were treated with vehicle (DMSO, top panel), CK666 (100 µM, second panel), the inactive analogue CK689 (100 µM, third panel) for 20 min, or treated with CK666 (100 µM) for 20 min followed by 30 min recovery in control medium (bottom panel). Red arrow: Arp2/3 complex enrichment. (C) Arp3 distribution profile sampled from the designated lines in B. (D) CK666 dose-dependent reduction of Arp2/3 complex enrichment at the leading edge. Red line: best fit curve using the 4-parameter nonlinear regression model (see Materials and methods), R2 = 0.9929. *, P < 0.01 with two-tailed unpaired t test versus the first data point (control). (E) Quantification of Arp2/3 complex enrichment at the leading edge for each condition in B. For images of 10- and 20-min CK666 washout, see Fig. S2 C. *, P < 0.01 with two-tailed unpaired t test. NS, not significant. (F) Fluorescent labeling of growth cones with Arp3 antibody and TRITC-phalloidin after live cell extraction. Growth cones were treated with vehicle (DMSO, top), CK666 (100 µM, middle) for 20 min, or treated with CK666 (100 µM, 20 min) followed by recovery in control medium for 30 min (bottom). (G) Arp3 distribution profiles sampled from the designated lines in F. (H) Quantification of Arp2/3 complex enrichment at the leading edge for each condition in F. *, P < 0.01 with two-tailed unpaired t test. NS, not significant. Yellow dotted lines demarcate the leading edge. Yellow arrows, intrapodia. Numbers in parentheses indicate growth cones measured. Bars, 10 µm.
Figure 2.
Figure 2.
Arp2/3 complex inhibition disrupts actin veil structure and leads to veil retraction in a dose- and time-dependent manner. (A) Periphery of growth cones treated with vehicle (DMSO, left) or different concentrations of CK666 for 20 min. (B) Periphery of growth cones treated with vehicle (DMSO, 20 min, left) or CK666 (100 µM) for 1, 5, or 10 min. Arrowheads, filopodial; asterisk, actin veil; arrows, edge of the veil. Yellow dashed squares are shown in F in higher magnification. (C) Periphery of a growth cone treated with CK689 (100 µM) for 20 min. For ultrastructures of the whole growth cones, see Fig. S2, E–G. (D) Leading edge of growth cones labeled with Alexa 594 phalloidin after normal fixation. Growth cones were treated with vehicle (DMSO, 20 min, top left), CK666 at different concentrations (25, 50, or 100 µM, 20 min, bottom), CK689 (100 µM, 20 min, top middle), or CK666 (100 µM, 20 min) followed by washout for 30 min (top right). See Fig. S3 A for whole growth cones. (E) Distribution of exposed filopodium lengths (yellow caliper in D) in histograms. See Fig. S3, B and C, for statistical analysis. (F) High magnification of areas marked by the yellow boxes in A showing representative veil network ultrastructure in control (left) and CK666-treated (50 µM, 20 min, right) growth cones. (G) Quantification of actin veil network parameters from 1 × 1 µm2 regions in distal P-domain similar to those in F. n, 97 regions from 8 GCs for control; 61 regions from 6 GCs for CK666. *, P < 0.01 with two-tailed unpaired t test. Bars: (A–C) 2 µm; (D) 5 µm; (F) 200 nm.
Figure 3.
Figure 3.
Arp2/3 complex inhibition reduces F-actin barbed end density along the leading edge. (A) Growth cones were dual-labeled with TRITC-phalloidin to show total F-actin (left) and Alexa 488 G-actin, which incorporates at barbed ends (right). Growth cones were treated with vehicle (DMSO, 20 min, top), CK666 (50 µM, 3 or 20 min), CK689 (100 µM, 20 min), or CK666 (50 µM, 20 min) followed by washout for 30 min. Yellow dotted line demarcates the leading edge. Arrow, intrapodia; arrowheads, barbed ends on filopodia. (B) Line scan analysis of barbed-end localization in growth cones under each condition in A. Scattered dots represent dataset from individual growth cones. Solid lines represent the population average. n, growth cones measured. (C) Average barbed-end intensities in the distal half of the P-domain in each condition. *, P < 0.01 with two-tailed unpaired t test versus control; NS, not significant.
Figure 4.
Figure 4.
Under control conditions, Arp2/3 complex inhibition increases peripheral retrograde actin flow but has little effect on actin turnover. (A) Representative G-actin FSM images (top) and corresponding flow maps (bottom) from a growth cone before, 20 min after treatment in 50 µM CK666, and 15 min after washout of CK666. Arrows in FSM images mark the edge of the actin veil. On the flow maps, colors encode speed (see color bar) and vectors indicate flow direction. (B–E) Summary of relative changes in retrograde actin flow rates after manipulations. (B) CK666 reversibility: before, during 50 µM CK666 treatment (15–30 min), and after washout (10–30 min). (C and D) Concentration dependence: treatment for 15–30 min with various concentrations of (C) CK666 or (D) CK689. (E) Treatment for 15–30 min with 50 µM CK869 or CK312. n, growth cones measured. (F) Map of time-averaged assembly (red) and disassembly (green) events detected near the leading edge of a growth cone before and after CK666 (50 µM, 20 min). Images were sampled from a region similar to the dotted blue box in A. Colors indicate relative assembly or disassembly rates (see color bars). Green arrow, polymerization sites on filopodia. (G) Plot of changes in integrated fluorescent intensity within the flow-displaced regions (see inset) tracked by ROI-Based Turnover Analysis before and after CK666 (50 µM, 20 min). n, 9 growth cones, 3–5 ROIs per growth cone. Images acquired every 5 s with 2 min elapsed recording time. Bars, 5 µm.
Figure 5.
Figure 5.
Under conditions of low myosin II activity, Arp2/3 complex inhibition decreases peripheral retrograde actin flow rates. (A) Representative G-actin FSM images (top) and corresponding flow maps (bottom) from a growth cone before and after CK666 (50 µM, 20 min) in the presence of blebbistatin (60 µM, 10 min pretreatment). Arrows in FSM images mark the edge of the actin veil. Insets, control actin and flow map recorded before blebbistatin addition. (B) Summary of relative changes in retrograde actin flow rates in response to increasing concentrations of CK666 (15–30 min) in the presence of blebbistatin. Flow rate decreases: 14.8 ± 1.2% with 25 µM, 24.5 ± 2.3% with 50 µM, and 43.0 ± 2.6% with 100 µM CK666. n, growth cones measured. (C) Representative phalloidin-FSM images (top) and corresponding flow maps (bottom) from a growth cone before and after CK666 (50 µM, 20 min) in the presence of Y27632 (10 µM, 20 min pretreatment). Average flow rate before: 4.75 µm/min; CK666: 6.08 µm/min. Insets: control actin and flow map recorded before Y27632 addition, average flow rate 4.73 µm/min. (D) Retrograde actin flow rates still increased by 19.6 ± 2.6% in response to CK666 (50 µM, 15–30 min) in the presence of Y27632 (10 µM, 20 min pretreatment). Flow rates in response to the same concentration of CK666 under control conditions from Fig. 4 C are shown for comparison. (E) Changes in peripheral retrograde actin flow rates in response to blebbistatin after Arp2/3 complex inhibition. Growth cones were pretreated with CK666 or inactive analogue CK689 (50 µM, 15–30 min), then treated with blebbistatin (60 µM, 10–30 min) in the continued presence of either CK666 or CK689. Flow rates were assessed before drug addition, during CK pretreatment, and during cotreatment with CK and blebbistatin. Population averages are shown. CK666 treatment increased the retrograde flow by 19.3 ± 3.2%. CK689 did not alter retrograde flow. In a CK666 background, blebbistatin decreased the flow by 65.6 ± 3.6%. In a CK689 background, blebbistatin decreased the flow by 20.1 ± 2.0%. Numbers in parenthesis: growth cones measured. (F) Map of time-averaged assembly (red) and disassembly (green) events detected near the leading edge of a growth cone before and after CK666 (50 µM, 20 min) in the presence of blebbistatin. Images were sampled from a region similar to the dotted blue box in A. Colors indicate relative assembly or disassembly rates (see color bars). (G) Plot of change in integrated fluorescent intensity within the flow-displaced regions before and after CK666 (50 µM, 20 min) in the presence of blebbistatin. n, 6 growth cones, 3–5 ROIs per growth cone. *, P < 0.01 with two-tailed paired t test. Images acquired every 5 s with 2 min elapsed recording time. Bars, 5 µm.
Figure 6.
Figure 6.
Myosin II inhibition does not affect Arp2/3 complex localization or barbed-end distribution. (A) Fluorescent labeling of growth cones with Arp3 antibody (right) and Alexa 594 phalloidin (left) after normal fixation. Growth cones were treated with blebbistatin (60 µM, 20 min, top) or pretreated with blebbistatin (60 µM, 10 min) followed by blebbistatin and CK666 (100 µM, 20 min, bottom). (B) Arp3 distribution profile sampled from the designated lines in A. (C) Quantification of Arp2/3 complex enrichment at the leading edge for each condition in A. The control from Fig. 1 E is shown for comparison. Numbers in parentheses indicate growth cones measured. *, P < 0.01 with two-tailed unpaired t test. (D) Growth cones were dual-labeled with TRITC-phalloidin to show total F-actin (left) and Alexa 488 G-actin, which incorporates at barbed ends (right). Growth cones were treated with blebbistatin (60 µM, 20 min, top) or pretreated with blebbistatin (60 µM, 10 min) followed by blebbistatin and CK666 (50 µM, 20 min, bottom). Yellow dotted line demarcates leading edge. Arrowheads: filopodia. (E) Line scan analysis of barbed end localization in growth cones under each condition in D. Scattered dots represent dataset from individual growth cones. Solid lines represent the population average. n, growth cones measured. (F) Average barbed-end intensities in the distal half of the P-domain in each condition. Data for control and CK666 (50 µM, 20 min) from Fig. 3 C are shown for comparison. *, P < 0.01 with two-tailed unpaired t test. NS, not significant. Bars: (A) 10 µm; (D) 5 µm.
Figure 7.
Figure 7.
Arp2/3 complex inhibition does not affect myosin II localization. (A) Fluorescent labeling of growth cones with myosin II antibody (right) and TRITC-phalloidin (left) after live cell extraction. Growth cones were treated with vehicle (DMSO, 20 min), CK666 (100 µM, 20 min), blebbistatin (60 µM, 20 min), or pretreated with blebbistatin (60 µM, 10 min) followed by blebbistatin and CK666 (100 µM, 20 min). (B) Line scan analysis of myosin II localization in growth cones under each condition in A. Line scans (50 pixels in width, 2x P-domain in length) were sampled along the growth axis of growth cones. Scattered dots represent dataset from individual growth cones. Solid lines represent the population average. n, growth cones measured. Yellow dotted lines demarcate leading edge. Bars, 10 µm.
Figure 8.
Figure 8.
Myosin II inhibition attenuates veil retraction but does not affect reductions in actin veil network densities evoked by Arp2/3 complex inhibition. (A) Electron micrographs of growth cones treated with blebbistatin (60 µM, 20 min, top) or pretreated with blebbistatin (60 µM, 10 min) followed by blebbistatin and CK666 (50 µM, 20 min, bottom). Blue boxed areas on the left panels are presented in high magnification on the right. Asterisk, actin veil; arrows, edge of veils. (B) Quantification of actin veil network properties from 1 × 1 µm2 regions in distal P-domain of growth cones treated as in A. Data for control and CK666-treated growth cones from Fig. 2 G are shown for comparison. n, 45 regions from 3 GCs for blebbistatin; 42 regions from 3 GCs for blebbistatin with CK666. *, P < 0.01 with two-tailed unpaired t test versus control; NS, not significant. (C) Representative images of the leading edge of growth cones treated as in A. See Fig. S5 A for the entire growth cones. (D) Histograms of exposed filopodium lengths. CK666 and control from Fig. 2 E for comparison. See Fig. S5, B and C, for statistical analysis. Bars: (A, both panels) 2 µm; (C) 5 µm.
Figure 9.
Figure 9.
Schematic summary. (A) Control. (B) Arp2/3 complex inhibition. (C) Arp2/3 complex inhibition in blebbistatin background.

Similar articles

Cited by

References

    1. Ahmad F.J., Hughey J., Wittmann T., Hyman A., Greaser M., Baas P.W. 2000. Motor proteins regulate force interactions between microtubules and microfilaments in the axon. Nat. Cell Biol. 2:276–280 10.1038/35010544 - DOI - PubMed
    1. Allingham J.S., Smith R., Rayment I. 2005. The structural basis of blebbistatin inhibition and specificity for myosin II. Nat. Struct. Mol. Biol. 12:378–379 10.1038/nsmb908 - DOI - PubMed
    1. Bailly M., Macaluso F., Cammer M., Chan A., Segall J.E., Condeelis J.S. 1999. Relationship between Arp2/3 complex and the barbed ends of actin filaments at the leading edge of carcinoma cells after epidermal growth factor stimulation. J. Cell Biol. 145:331–345 10.1083/jcb.145.2.331 - DOI - PMC - PubMed
    1. Borisy G.G., Svitkina T.M. 2000. Actin machinery: pushing the envelope. Curr. Opin. Cell Biol. 12:104–112 10.1016/S0955-0674(99)00063-0 - DOI - PubMed
    1. Brown J.A., Wysolmerski R.B., Bridgman P.C. 2009. Dorsal root ganglion neurons react to semaphorin 3A application through a biphasic response that requires multiple myosin II isoforms. Mol. Biol. Cell. 20:1167–1179 10.1091/mbc.E08-01-0065 - DOI - PMC - PubMed

Publication types