Comparative Study
. 2012 Aug 15;28(16):2106-13.
doi: 10.1093/bioinformatics/bts342. Epub 2012 Jun 17.

Associating microbiome composition with environmental covariates using generalized UniFrac distances

Affiliations
Comparative Study

Associating microbiome composition with environmental covariates using generalized UniFrac distances

Jun Chen et al. Bioinformatics. .

Abstract

Motivation: The human microbiome plays an important role in human disease and health. Identification of factors that affect the microbiome composition can provide insights into disease mechanism as well as suggest ways to modulate the microbiome composition for therapeutical purposes. Distance-based statistical tests have been applied to test the association of microbiome composition with environmental or biological covariates. The unweighted and weighted UniFrac distances are the most widely used distance measures. However, these two measures assign too much weight either to rare lineages or to most abundant lineages, which can lead to loss of power when the important composition change occurs in moderately abundant lineages.

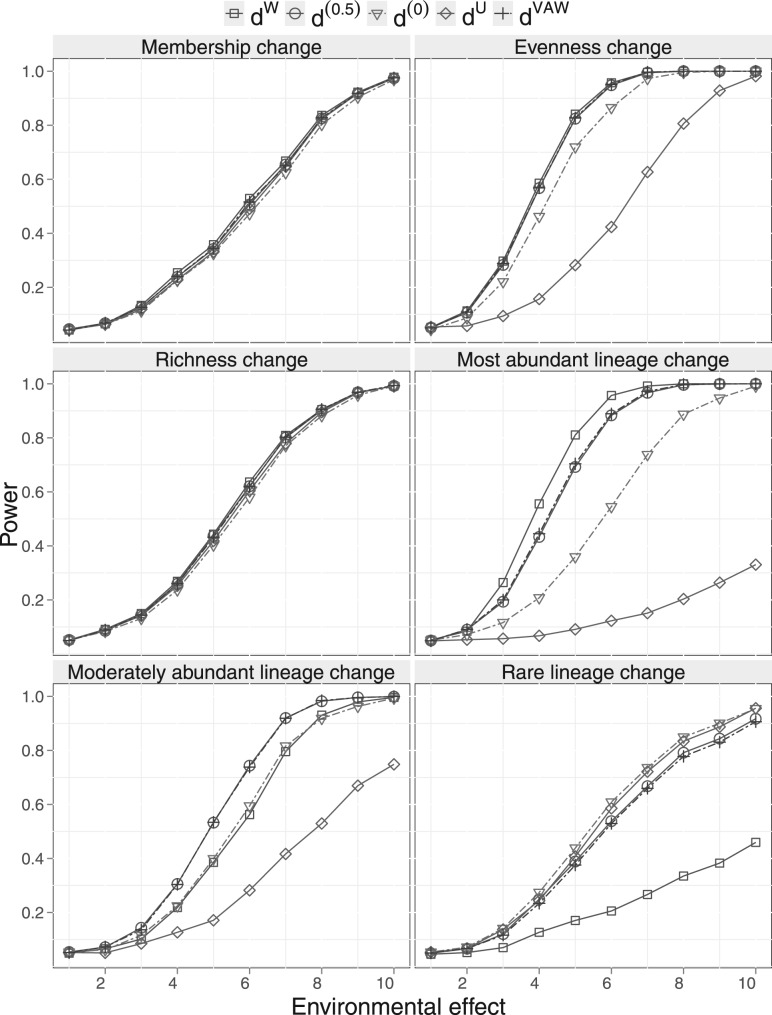
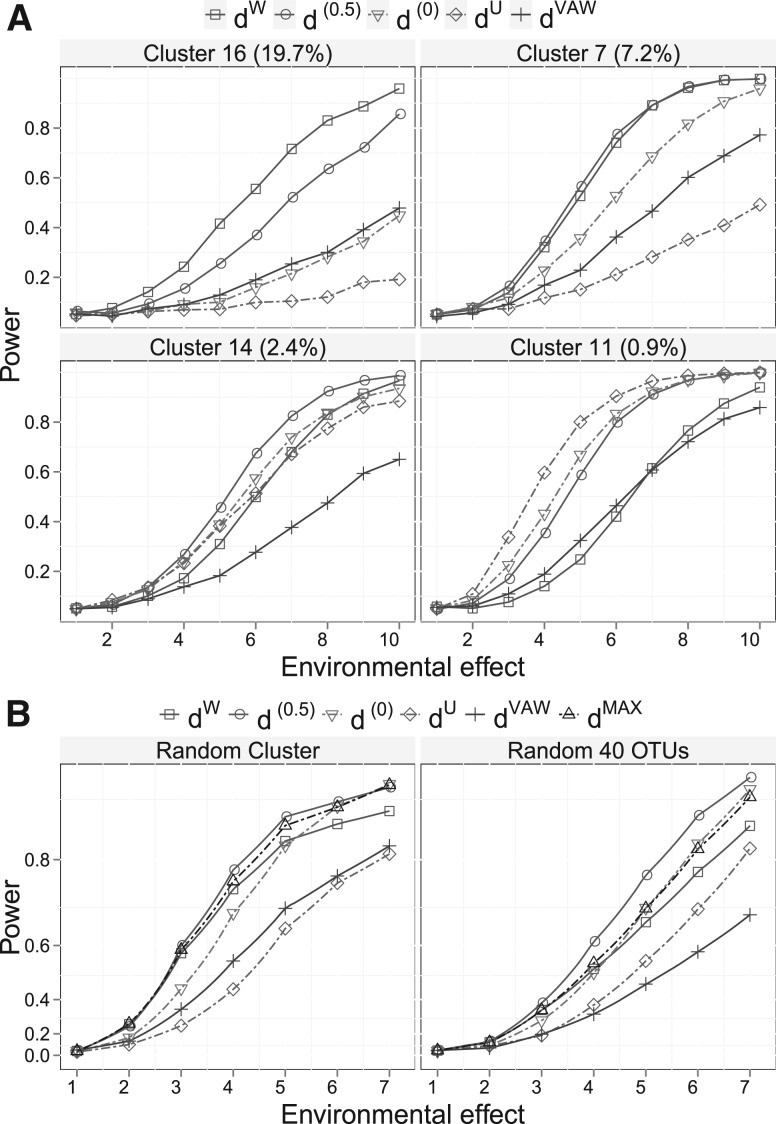
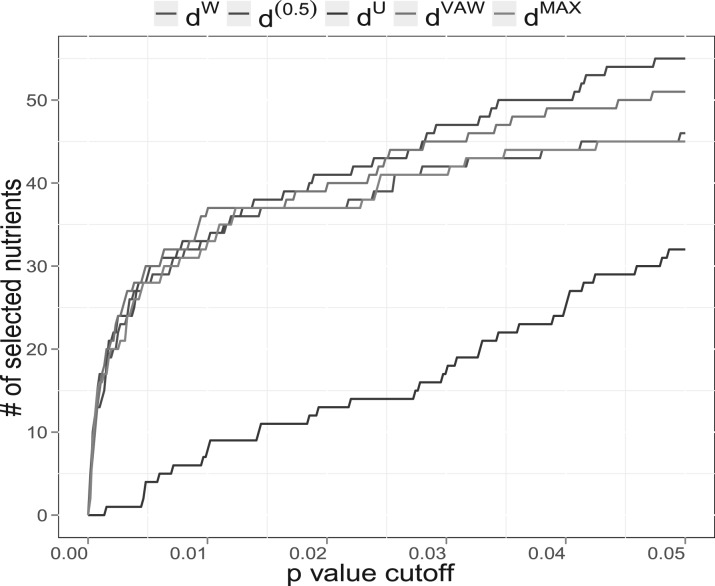
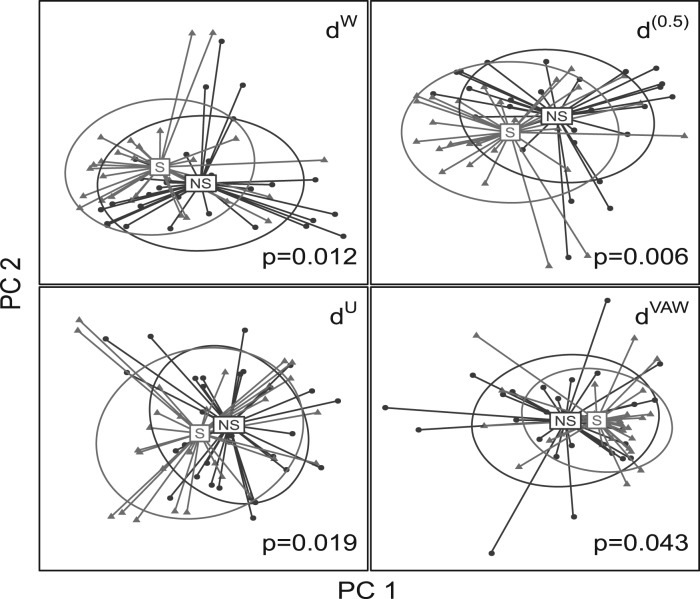
Results: We develop generalized UniFrac distances that extend the weighted and unweighted UniFrac distances for detecting a much wider range of biologically relevant changes. We evaluate the use of generalized UniFrac distances in associating microbiome composition with environmental covariates using extensive Monte Carlo simulations. Our results show that tests using the unweighted and weighted UniFrac distances are less powerful in detecting abundance change in moderately abundant lineages. In contrast, the generalized UniFrac distance is most powerful in detecting such changes, yet it retains nearly all its power for detecting rare and highly abundant lineages. The generalized UniFrac distance also has an overall better power than the joint use of unweighted/weighted UniFrac distances. Application to two real microbiome datasets has demonstrated gains in power in testing the associations between human microbiome and diet intakes and habitual smoking.

Availability: http://cran.r-project.org/web/packages/GUniFrac


Figures

Fig. 1
Fig. 1
Two simulation strategies to evaluate the generalized UniFrac distances. (A–G), 2D circle-based simulation of microbial communities with different characteristics. (A) The microbial community is represented by a 2D circle. Points are drawn from the circle to simulate the 16S-based sampling process. These points are further binned into small hexagons as OTUs. UPGMA or NJ method is used to build the OTU phylogenetic tree. Six scenarios are investigated, where the difference occurs in: community membership (B), evenness (C), richness (D), most abundant lineages (E), moderately abundant lineages (F) and rare lineages (G). The affected lineages are indicated by a red circle or ring. H, tree-based simulation of microbial communities based on the phylogenetic tree and DM model. A real OTU phylogenetic tree from a throat microbial community dataset is used. These OTUs are roughly divided into 20 clusters (lineages) by performing PAM method using the OTU patristic distance matrix. Each cluster is subjected to abundance change in response to the environment. Counts are generated from a DM model.
Fig. 2
Fig. 2
Power comparison of different UniFrac variants for detecting environmental effect using 2D circle-based simulation. PERMANOVA is used for testing hypotheses. The specific community difference caused by different environmental conditions is indicated in the panel title. The power curves are created by varying the degree of environmental effect. The initial point of the power curve is the power when there is no environmental effect.
Fig. 3
Fig. 3
Power comparison of different UniFrac variants for detecting environmental effect using tree-based simulation. PERMANOVA is used for testing hypotheses. The power curves are created by varying the degree of environmental effect. (A) The environmental factor affects a particular lineage (OTU cluster). Four example lineages of different abundance levels that are affected by environment are given. The lineage abundance is given in parentheses in the panel title. (B) The environmental factor affects a random lineage (left panel) or a random subset of 40 OTUs (right panel). The initial point of the power curve is the power when there is no environmental effect.
Fig. 4
Fig. 4
Comparison of different UniFrac variants for detecting nutrient effects on gut microbiome composition. PERMANOVA is used for testing hypotheses. 214 nutrients are included in the testing. The curves are generated by varying the P-value cutoffs.
Fig. 5
Fig. 5
Comparison of different UniFrac variants for clustering samples from smokers and non-smokers. Principle coordinate analysis is performed on the distance matrices of dW, d(0.5), dU and dVAW. The samples are plotted on the first two principle coordinates. The PERMANOVA P-values are also indicated in this figure. The ellipse center indicates groups means, its main axis corresponds to the first two principle components from principle component analysis and the height and width are variances on that direction.

References

    1. Arumugam M., et al. Enterotypes of the human gut microbiome. Nature. 2011;473:174–180. - PMC - PubMed
    1. Caporaso J., et al. Qiime allows analysis of high-throughput community sequencing data. Nat. Methods. 2010;7:335–336. - PMC - PubMed
    1. Carr D., et al. hexbin: Hexagonal Binning Routines. 2011
    1. Chang Q., et al. Variance adjusted weighted UniFrac: a powerful beta diversity measure for comparing communities based on phylogeny. BMC Bioinformatics. 2011;12:118. - PMC - PubMed
    1. Charlson E., et al. Disordered microbial communities in the upper respiratory tract of cigarette smokers. PLoS One. 2010;5:e15216. - PMC - PubMed

Publication types