

Predictability of population displacement after the 2010 Haiti earthquake
- PMID: 22711804
- PMCID: PMC3406871
- DOI: 10.1073/pnas.1203882109
Predictability of population displacement after the 2010 Haiti earthquake
Abstract
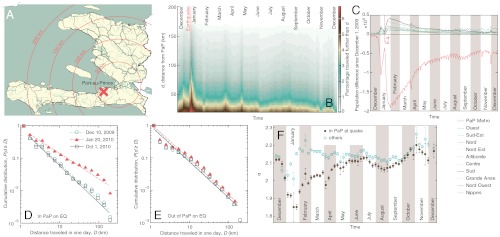
Most severe disasters cause large population movements. These movements make it difficult for relief organizations to efficiently reach people in need. Understanding and predicting the locations of affected people during disasters is key to effective humanitarian relief operations and to long-term societal reconstruction. We collaborated with the largest mobile phone operator in Haiti (Digicel) and analyzed the movements of 1.9 million mobile phone users during the period from 42 d before, to 341 d after the devastating Haiti earthquake of January 12, 2010. Nineteen days after the earthquake, population movements had caused the population of the capital Port-au-Prince to decrease by an estimated 23%. Both the travel distances and size of people's movement trajectories grew after the earthquake. These findings, in combination with the disorder that was present after the disaster, suggest that people's movements would have become less predictable. Instead, the predictability of people's trajectories remained high and even increased slightly during the three-month period after the earthquake. Moreover, the destinations of people who left the capital during the first three weeks after the earthquake was highly correlated with their mobility patterns during normal times, and specifically with the locations in which people had significant social bonds. For the people who left Port-au-Prince, the duration of their stay outside the city, as well as the time for their return, all followed a skewed, fat-tailed distribution. The findings suggest that population movements during disasters may be significantly more predictable than previously thought.
Conflict of interest statement
The authors declare no conflict of interest.
Figures
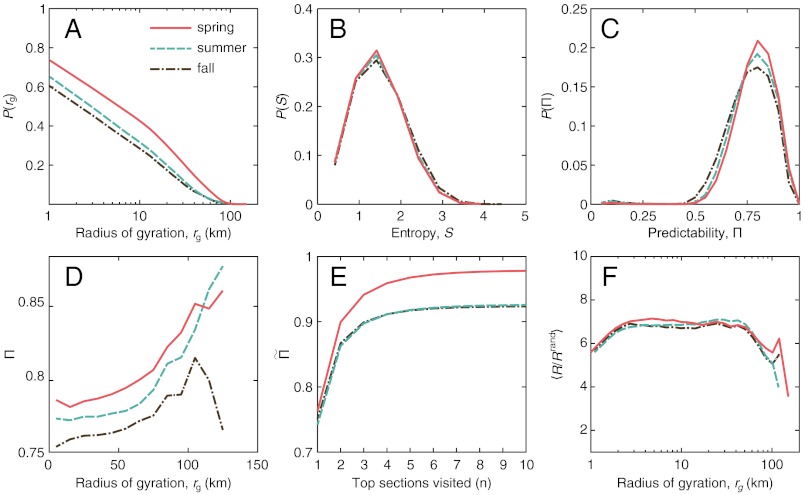
 . (F) gives the averaged R/Rrand versus the radius of gyration rg, showing a relative stable dependence.
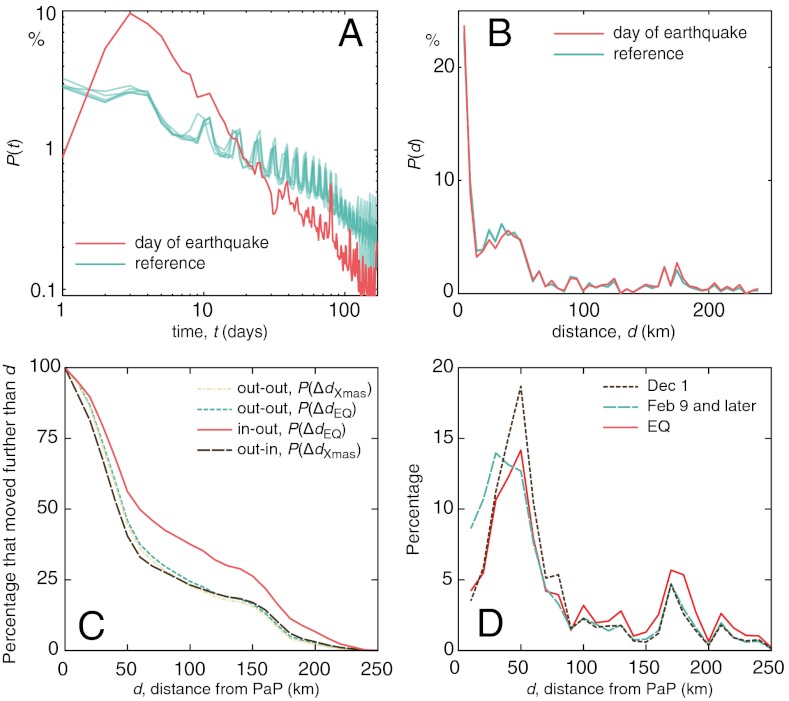
Comment in
-
Population movement under extreme events.Proc Natl Acad Sci U S A. 2012 Jul 17;109(29):11472-3. doi: 10.1073/pnas.1209306109. Epub 2012 Jul 9. Proc Natl Acad Sci U S A. 2012. PMID: 22778423 Free PMC article. No abstract available.
References
-
- Guha-Sapir D, Vos F, Below R, Ponserre S. Annual Disaster Statistical Review 2010: The Numbers and Trends. Brussels: CRED; 2011.
-
- IDMC and Norwegian Refugee Council. Displacement Due to Natural Hazard-Induced Disasters: Global Estimates for 2009 and 2010. Geneva: IDMC and Norwegian Refugee Council; 2011.
-
- Brown V, et al. Rapid assessment of population size by area sampling in disaster situations. Disasters. 2001;25:164–171. - PubMed
-
- Depoortere E, Brown V. Rapid Health Assessment of Refugee or Displaced Populations. 3rd Ed. Paris: Médecins Sans Frontières; 2006.
-
- Levine JN, Esnard AM, Sapat A. Population displacement and housing dilemmas due to catastrophic disasters. J Plann Lit. 2007;22:3–15.
Publication types
MeSH terms
LinkOut - more resources
Full Text Sources
Other Literature Sources
Medical
