. 2012 Jul 15;189(2):793-803.
doi: 10.4049/jimmunol.1200411. Epub 2012 Jun 18.

Murine lupus susceptibility locus Sle1c2 mediates CD4+ T cell activation and maps to estrogen-related receptor γ

Affiliations

Murine lupus susceptibility locus Sle1c2 mediates CD4+ T cell activation and maps to estrogen-related receptor γ

Daniel J Perry et al. J Immunol. .

Abstract

Sle1c is a sublocus of the NZM2410-derived Sle1 major lupus susceptibility locus. We have shown previously that Sle1c contributes to lupus pathogenesis by conferring increased CD4(+) T cell activation and increased susceptibility to chronic graft-versus-host disease (cGVHD), which mapped to the centromeric portion of the locus. In this study, we have refined the centromeric sublocus to a 675-kb interval, termed Sle1c2. Mice from recombinant congenic strains expressing Sle1c2 exhibited increased CD4(+) T cell intrinsic activation and cGVHD susceptibility, similar to mice with the parental Sle1c. In addition, B6.Sle1c2 mice displayed a robust expansion of IFN-γ-expressing T cells. NZB complementation studies showed that Sle1c2 expression exacerbated B cell activation, autoantibody production, and renal pathology, verifying that Sle1c2 contributes to lupus pathogenesis. The Sle1c2 interval contains two genes, only one of which, Esrrg, is expressed in T cells. B6.Sle1c2 CD4(+) T cells expressed less Esrrg than B6 CD4(+) T cells, and Esrrg expression was correlated negatively with CD4(+) T cell activation. Esrrg encodes an orphan nuclear receptor that regulates oxidative metabolism and mitochondrial functions. In accordance with reduced Esrrg expression, B6.Sle1c2 CD4(+) T cells present reduced mitochondrial mass and altered mitochondrial functions as well as altered metabolic pathway utilization when compared with B6 CD4(+) T cells. Taken together, we propose Esrrg as a novel lupus susceptibility gene regulating CD4(+) T cell function through their mitochondrial metabolism.


Figures

FIGURE 1
FIGURE 1
Physical map of Sle1c. A, The Sle1c and its recombinant intervals (REC1 to REC8) are shown on the telomeric end of chromosome 1 with NZW-derived regions in white and B6-derived regions in black. All known polymorphic MIT microsatellite markers, as well as SNPs that define recombination intervals are depicted. B, Sle1c2 is defined by the non-overlapping centrometric end of Sle1c that carries the NZW alleles in REC5 and REC2b (Sle1c2w), and the B6 alleles in the other strains (Sle1c2b). The SNPs defining the areas of recombination on both ends are shown, along with the exonintron structure of the two known protein coding genes located in Sle1c2. Scale is in Mb and all positions are current with Ensemble release 67 (www.ensembl.org/Mus_musculus/), which is based on NCBI m37.
FIGURE 2
FIGURE 2
Phenotypic mapping of Sle1c2. A, Comparison of spleen weights, CD4:CD8 ratios, CD69 expression and Tem percentages of CD4+ T cells from spleens of 10–14 month old mice. Significance levels indicate ANOVA with Dunn's multiple comparison analysis to B6. Ag-specific (B), polyclonal (C), and PMA-induced (D) proliferation of CD4+ T cells from 3–5 month old mice was measured by 3H thymidine incorporation, and stimulation indexes were calculated relative to cultures with medium only. Both REC2b.OTII and REC5.OTII strains were used as Sle1c2.OTII. Two-way ANOVA (‡‡) was used to measure strain effect on Ag-specific proliferation with Bonferroni's post-test indicating significance at each concentration in B. Mann-Whitney was used in C and t test was used in D. Absolute numbers of splenic CD4+ T cells (E) and of B and CD8+ T cells (F) were compared between B6 and B6.Sle1c2 at 5–8 and 10–14 month old cohorts. Naïve T cells were defined as CD4+ CD44lo CD62L+ and Tem cells were defined as CD4+ CD44hi CD62L. Significance levels indicate Mann-Whitney comparisons to B6 mice of the same age group. * P ≤ 0.05, ** P ≤ 0.01, *** P ≤ 0.001, ‡‡ P ≤ 0.001.
FIGURE 3
FIGURE 3
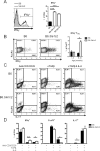
Sle1c2 upregulates IFNγ expression. A, Representative histograms and quantification of ex vivo IFNγ intracellular staining in CD4+ T cells were from the spleens of 2–3 month old mice. Significance levels indicate ANOVA with Dunn's multiple comparison analysis to B6. B, Representative plots and quantitation of FoxP3+ IFNγ+ double positive CD4+ T cells after 3 d of culture with plate-bound anti-CD3/CD28 and TGFβ. Cells were collected from 1–3 and 8–10 month old mice. C, D, Representative plots (C) and quantification (D) of intracellular staining for IFNγ, FoxP3, and IL-17 in CD4+ T cells from 8–10 month old mice after 3 d of TH0 (anti-CD3 and anti-CD28 only), Treg (stimulation plus TGFβ), and TH17 (stimulation plus TGFβ and IL-6) polarizing conditions. In B and D, t tests compare B6 to Sle1c2 mice for each age or treatment group. : * P ≤ 0.05, ** P ≤ 0.01, *** P ≤ 0.001.
FIGURE 4
FIGURE 4
Sle1c2 enhances induced lupus phenotypes in the cGVHD model. cGVHD was induced in B6 (filled circles) and B6.Sle1c2 (open circles) and splenic compartments were compared by flow cytometry 3 weeks later. Age-matched non-induced mice are also shown as control. A, CD4+ T cell activation was assessed by high forward scatter (indicative of blasting cells), CD69 expression and by expansion of Tem cells. B, Dendritic cell activation was indicated by B7–2 (CD86) expression. C, B cell activation was measured by CD22, CD69, B7–1 (CD80) and B7–2 expression. D, Glomerular IgG2a and C3 deposition was detected in frozen kidney sections. Sections were separately scored for each Ab and additive values (IgG2a score + C3 score) are shown. E, Weekly serum anti-chromatin and anti-dsDNA IgG were measured by ELISA. A, B, C, and E were compared by Mann-Whitney tests and D was compared by 2-way ANOVA with Bonferroni's post-test. * P ≤ 0.05, ** P ≤ 0.01, *** P ≤ 0.001.
FIGURE 5
FIGURE 5
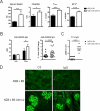
Sle1c2 exacerbates spontaneous lupus phenotypes induced by the NZB genome. A, Spleen weight, CD4:CD8 ratios, percentage of CD62L CD44hi CD4+ and B7–2+ B220+ splenocytes in 12 month old (NZB × B6)F1 and (NZB × B6.Sle1c2)F1 mice (n=14 and 25, respectively). B, Serum anti-dsDNA IgG is shown as unit values at 5 and 12 months of age, and as relative individual increase between these two ages for each strain. C and D, Glomerular IgG and C3 deposition was detected in frozen kidney sections. Sections were separately scored for each Ab and additive values (IgG score + C3 score) are shown in C. Representative sections (X 100) are shown in D. Mann-Whitney tests: * P ≤ 0.05, ** P ≤ 0.01, *** P ≤ 0.001.
FIGURE 6
FIGURE 6
Esrrg expression is decreased in Sle1c2 CD4+ T cells. A, qPCR comparing Esrrg expression in thymocytes, splenocytes, CD4+ T cells, and CD4 fractions between B6 and B6.Sle1c2 (8–10 month old, n=7 per strain). t tests were used to compare B6.Sle1c2 Esrrg expression to B6 for each cell population. B, ERRγ expression was analyzed in B6 and B6.Sle1c2 CD4+ T cells by semi-quantitative Western blotting, with cell lysates undiluted, diluted 1:2 (0.5) and 1:4 (0.25). The ERRγ protein abundance was normalized to the expression of GAPDH. The numbers in Y axis indicate the ratio of normalized ERRγ protein abundance in B6.Sle1c2 CD4+ cells to that in B6 CD4+ cells. C, Correlation between Esrrg expression and CD69+ and Tem percentages of splenic CD4+ T cells. The young and old cohorts were 2–3 and 7–8 months old, respectively. The significance that slopes do not equal zero (P) and correlation coefficients for linear regressions (R2) are shown. D, qPCR analysis of Hif1a, Slc16a3, and Pkm2 expression in B6 and B6.Sle1c2 CD4+ splenocytes, compared with Mann-Whitney tests. E, Percent change in expression of genes in metabolic pathways from microarray analysis comparing B6.Sle1c2 to B6 CD4+ T cells. * P ≤ 0.05, ** P ≤ 0.01, *** P ≤ 0.001.
FIGURE 7
FIGURE 7
Mitochondrial function is impaired in the CD4+ T cells of B6.Sle1c2 mice. AE, Splenic CD3+ CD4+ T cells were assessed by flow cytometry for mitochondrial mass (A), mitochondrial membrane potential (B), oxidation (C), Ca (D) and NO (E) contents. The graphs show mean + SEM mean fluorescence intensity (MFI) normalized to B6 mean values. F, viability analysis of ex-vivo splenocytes based on Annexin V (Ann V) and PI staining. Live cells were Ann V PI. G, VDAC expression in CD4+ T cells analyzed by Western blot. β-actin expression is shown as a control. The graph on the right shows the densitometry analysis of the VDAC/ β-actin ratios normalized to one B6 sample. All data were collected from the same 2–3 months old mice. B6 and B6.Thy1a (B6 a) values were pooled in the graphs under B6 and compared to B6.Sle1c2 values with Mann-Whitney tests. * P ≤ 0.05, ** P ≤ 0.01, *** P ≤ 0.001.

References

    1. Perry D, Sang A, Yin Y, Zheng YY, Morel L. Murine models of systemic lupus erythematosus. J. Biomed. Biotechnol. 2011;2011:271694. - PMC - PubMed
    1. Morel L, Rudofsky UH, Longmate JA, Schiffenbauer J, Wakeland EK. Polygenic control of susceptibility to murine systemic lupus erythematosus. Immunity. 1994;1:219–229. - PubMed
    1. Boackle SA, Holers VM, Chen XJ, Szakonyi G, Karp DR, Wakeland EK, Morel L. Cr2, a candidate gene in the murine Sle1c lupus susceptibility locus, encodes a dysfunctional protein. Immunity. 2001;15:775–785. - PubMed
    1. Mohan C, Alas E, Morel L, Yang P, Wakeland EK. Genetic dissection of SLE pathogenesis - Sle1 on murine chromosome 1 leads to a selective loss of tolerance to H2A/H2B/DNA subnucleosomes. J. Clin. Invest. 1998;101:1362–1372. - PMC - PubMed
    1. Sobel ES, Mohan C, Morel L, Schiffenbauer J, Wakeland EK. Genetic dissection of SLE pathogenesis: Adoptive transfer of Sle1 mediates the loss of tolerance by bone marrow-derived B cells. J. Immunol. 1999;162:2415–2421. - PubMed

Publication types

MeSH terms