

Influence of exercise intensity on skeletal muscle blood flow, O2 extraction and O2 uptake on-kinetics
- PMID: 22711961
- PMCID: PMC3473291
- DOI: 10.1113/jphysiol.2012.233064
Influence of exercise intensity on skeletal muscle blood flow, O2 extraction and O2 uptake on-kinetics
Abstract
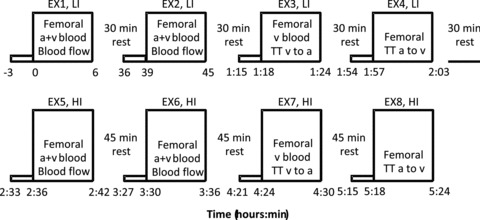
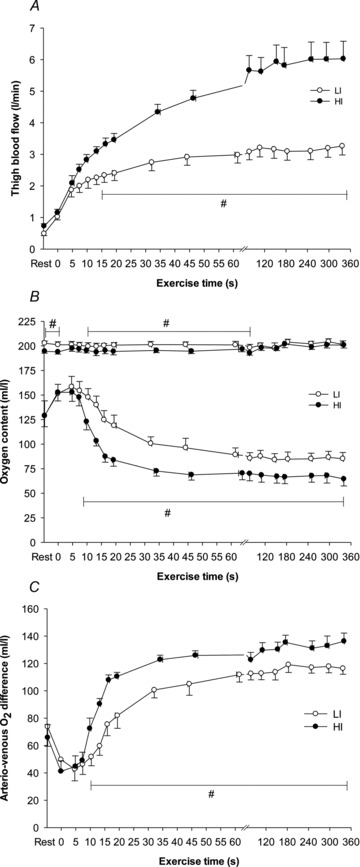
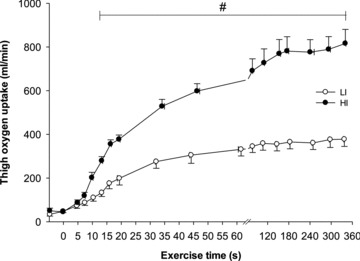
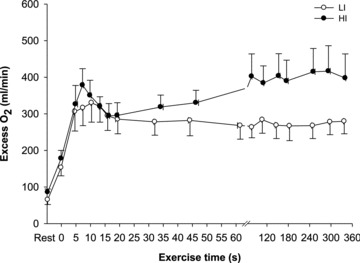
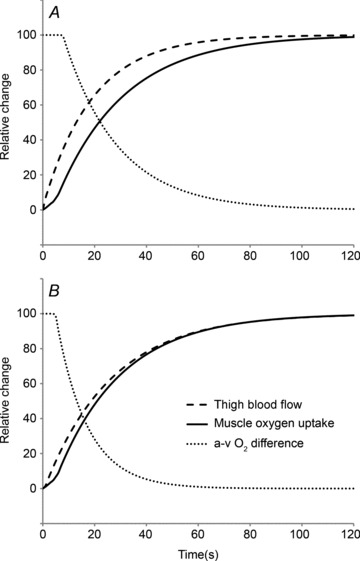
Following the start of low-intensity exercise in healthy humans, it has been established that the kinetics of skeletal muscle O(2) delivery is faster than, and does not limit, the kinetics of muscle O(2) uptake (V(O(2)(m))). Direct data are lacking, however, on the question of whether O(2) delivery might limit (V(O(2)(m))) kinetics during high-intensity exercise. Using multiple exercise transitions to enhance confidence in parameter estimation, we therefore investigated the kinetics of, and inter-relationships between, muscle blood flow (Q(m)), a-(V(O(2))) difference and (V(O(2)(m))) following the onset of low-intensity (LI) and high-intensity (HI) exercise. Seven healthy males completed four 6 min bouts of LI and four 6 min bouts of HI single-legged knee-extension exercise. Blood was frequently drawn from the femoral artery and vein during exercise and Q(m), a-(V(O(2))) difference and (V(O(2)(m))) were calculated and subsequently modelled using non-linear regression techniques. For LI, the fundamental component mean response time (MRT(p)) for Q(m) kinetics was significantly shorter than (V(O(2)(m))) kinetics (mean ± SEM, 18 ± 4 vs. 30 ± 4 s; P < 0.05), whereas for HI, the MRT(p) for Q(m) and (V(O(2)(m))) was not significantly different (27 ± 5 vs. 29 ± 4 s, respectively). There was no difference in the MRT(p) for either Q(m) or (V(O(2)(m))) between the two exercise intensities; however, the MRT(p)for a-(V(O(2)) difference was significantly shorter for HI compared with LI (17 ± 3 vs. 28 ± 4 s; P < 0.05). Excess O(2), i.e. oxygen not taken up (Q(m) x (V(O(2))), was significantly elevated within the first 5 s of exercise and remained unaltered thereafter, with no differences between LI and HI. These results indicate that bulk O(2) delivery does not limit (V(O(2)(m))) kinetics following the onset of LI or HI knee-extension exercise.
Figures
Similar articles
-
Muscular and pulmonary O2 uptake kinetics during moderate- and high-intensity sub-maximal knee-extensor exercise in humans.J Physiol. 2009 Apr 15;587(Pt 8):1843-56. doi: 10.1113/jphysiol.2008.166397. Epub 2009 Mar 2. J Physiol. 2009. PMID: 19255119 Free PMC article.
-
Relationship between (non)linear phase II pulmonary oxygen uptake kinetics with skeletal muscle oxygenation and age in 11-15 year olds.Exp Physiol. 2019 Dec;104(12):1929-1941. doi: 10.1113/EP087979. Epub 2019 Oct 17. Exp Physiol. 2019. PMID: 31512297
-
Perfusion heterogeneity does not explain excess muscle oxygen uptake during variable intensity exercise.Clin Physiol Funct Imaging. 2010 Jul;30(4):241-9. doi: 10.1111/j.1475-097X.2010.00934.x. Epub 2010 May 11. Clin Physiol Funct Imaging. 2010. PMID: 20491840 Clinical Trial.
-
Effects of ageing on muscle O2 utilization and muscle oxygenation during the transition to moderate-intensity exercise.Appl Physiol Nutr Metab. 2007 Dec;32(6):1251-62. doi: 10.1139/H07-121. Appl Physiol Nutr Metab. 2007. PMID: 18059603 Review.
-
How to Equalize High- and Low-Intensity Endurance Exercise Dose.Int J Sports Physiol Perform. 2024 Jul 19;19(9):851-859. doi: 10.1123/ijspp.2024-0015. Print 2024 Sep 1. Int J Sports Physiol Perform. 2024. PMID: 39032919 Review.
Cited by
-
MRS Evidence of Adequate O₂ Supply in Human Skeletal Muscle at the Onset of Exercise.Med Sci Sports Exerc. 2015 Nov;47(11):2299-307. doi: 10.1249/MSS.0000000000000675. Med Sci Sports Exerc. 2015. PMID: 25830362 Free PMC article.
-
Reproducibility of the 6-minute walk test in lung transplant recipients.Wien Klin Wochenschr. 2023 Oct;135(19-20):517-527. doi: 10.1007/s00508-022-02132-w. Epub 2022 Dec 28. Wien Klin Wochenschr. 2023. PMID: 36576557 Free PMC article.
-
Effects of Blood Flow Restriction on O2 Muscle Extraction and O2 Pulmonary Uptake Kinetics During Heavy Exercise.Front Physiol. 2021 Sep 1;12:722848. doi: 10.3389/fphys.2021.722848. eCollection 2021. Front Physiol. 2021. PMID: 34539445 Free PMC article.
-
Near-infrared spectroscopy of superficial and deep rectus femoris reveals markedly different exercise response to superficial vastus lateralis.Physiol Rep. 2017 Sep;5(17):e13402. doi: 10.14814/phy2.13402. Physiol Rep. 2017. PMID: 28912130 Free PMC article.
-
Aging increases metabolic capacity and reduces work efficiency during handgrip exercise in males.J Appl Physiol (1985). 2023 May 1;134(5):1154-1164. doi: 10.1152/japplphysiol.00411.2022. Epub 2023 Mar 23. J Appl Physiol (1985). 2023. PMID: 36958347 Free PMC article.
References
-
- Andersen P, Adams RP, Sjøgaard G, Thorboe A, Saltin B. Dynamic knee extension as a model for the study of an isolated exercising muscle in man. J Appl Physiol. 1985;59:1647–1653. - PubMed
-
- Bangsbo J, Krustrup P, González-Alonso J, Boushel R, Saltin B. Muscle oxygen uptake kinetics at onset of intense dynamic exercise. Am J Physiol Regul Integr Comp Physiol. 2000;279:R899–R906. - PubMed
-
- Barstow TJ, Jones AM, Nguyen PH, Casaburi R. Influence of muscle fiber type and pedal frequency on oxygen uptake kinetics of heavy exercise. J Appl Physiol. 1996;81:1624–1650. - PubMed
Publication types
MeSH terms
Substances
LinkOut - more resources
Full Text Sources
Medical