Lingual tactile acuity and food texture preferences among children and their mothers
- PMID: 22711981
- PMCID: PMC3375994
- DOI: 10.1016/j.foodqual.2012.03.007
Lingual tactile acuity and food texture preferences among children and their mothers
Abstract
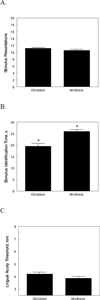
Despite anecdotal reports of children being more sensitive to texture than adults, and of texture being one of the main drivers of food aversions, there is a paucity of scientific knowledge on the influence of texture perception on food choice in children. The primary goals of this study were to assess the use of a modified letter-identification task to study lingual tactile acuity, one aspect of oral sensitivity, in children and to examine age-related differences in sensitivity. The secondary goal was to explore whether lingual tactile acuity and age relate to various measures of food choice and preference. To this end, children 7-10 years old (31 girls, 21 boys) and their mothers were tested using identical procedures. To assess lingual tactile acuity, children and mothers were asked to use the tips of their tongues to identify raised alphabetical letters of varying size (2.5-8.0 mm) on Teflon strips. To relate lingual tactile acuity to food texture preferences, a forced-choice questionnaire assessed preferences for foods similar in flavor but different in texture (e.g., smooth versus crunchy peanut butter). Children were able to complete the lingual acuity task as well as their mothers and took less time to assess each letter stimulus (p < 0.001); however, there were no age-related differences in lingual acuity (p = 0.14). Age, but not lingual acuity, related to food texture preferences: mothers preferred harder foods (p < 0.001) and those containing more particles (p < 0.04) than did children, although children's preferences became more adult-like with increasing age. The availability of a rapid, child-friendly method for assessing oral sensitivity opens up new possibilities of examining differences in oral tactile perceptions across the life span. That food preferences changed with age and were not related to oral sensitivity underscores the fact that factors such as experience, culture and family food practices have a significant impact on children's food texture preferences.
Figures


References
-
- Baxter IA, Schroder MJA. Vegetable consumption among Scottish children: a review of the determinants and proposed strategies to overcome low consumption. Brit Food J. 1997;99(10):380–387.
-
- Birch LL. Development of food preferences. Annu Rev Nutr. 1999;19:41–62. - PubMed
-
- Blossfeld I, Collins A, Kiely M, Delahunty C. Texture preferences of 12-month-old infants and the role of early experiences. Food Quality and Preference. 2007;18:396–404.
-
- Boliek CA, Rieger JM, Li SY, Mohamed Z, Kickham J, Amundsen K. Establishing a reliable protocol to measure tongue sensation. J Oral Rehabil. 2007;34(6):433–441. - PubMed
-
- Bourne M. Food Texture and Viscosity: Concept and Measurement. London: Academic Press; 2002.
Grants and funding
LinkOut - more resources
Full Text Sources
