. 2012 Aug;32(16):3281-92.
doi: 10.1128/MCB.00173-12. Epub 2012 Jun 18.

The CACCC-binding protein KLF3/BKLF represses a subset of KLF1/EKLF target genes and is required for proper erythroid maturation in vivo

Affiliations

The CACCC-binding protein KLF3/BKLF represses a subset of KLF1/EKLF target genes and is required for proper erythroid maturation in vivo

Alister P W Funnell et al. Mol Cell Biol. 2012 Aug.

Abstract

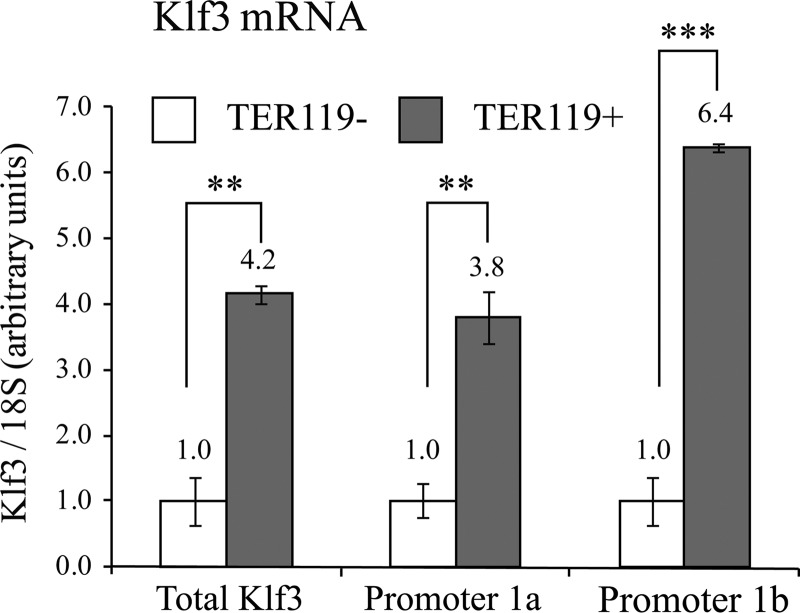
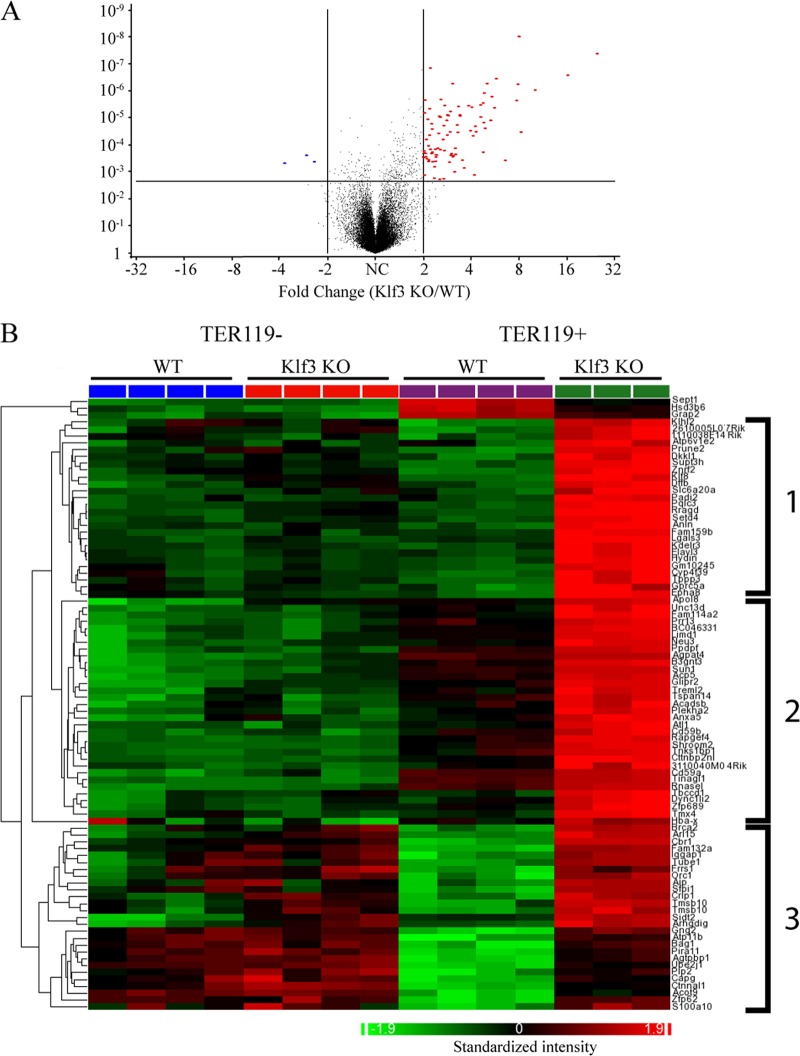
The CACCC-box binding protein erythroid Krüppel-like factor (EKLF/KLF1) is a master regulator that directs the expression of many important erythroid genes. We have previously shown that EKLF drives transcription of the gene for a second KLF, basic Krüppel-like factor, or KLF3. We have now tested the in vivo role of KLF3 in erythroid cells by examining Klf3 knockout mice. KLF3-deficient adults exhibit a mild compensated anemia, including enlarged spleens, increased red pulp, and a higher percentage of erythroid progenitors, together with elevated reticulocytes and abnormal erythrocytes in the peripheral blood. Impaired erythroid maturation is also observed in the fetal liver. We have found that KLF3 levels rise as erythroid cells mature to become TER119(+). Consistent with this, microarray analysis of both TER119(-) and TER119(+) erythroid populations revealed that KLF3 is most critical at the later stages of erythroid maturation and is indeed primarily a transcriptional repressor. Notably, many of the genes repressed by KLF3 are also known to be activated by EKLF. However, the majority of these are not currently recognized as erythroid-cell-specific genes. These results reveal the molecular and physiological function of KLF3, defining it as a feedback repressor that counters the activity of EKLF at selected target genes to achieve normal erythropoiesis.


Figures

Fig 1
Fig 1
Peripheral red blood cell parameters of Klf3−/− adult mice. (A to G) Full peripheral blood count analysis was performed on 20 Klf3+/+ and 20 Klf3−/− mice, 10 to 20 weeks old. (H) Representative flow cytometry plot of four Klf3+/+ and four Klf3−/− mice, showing peripheral blood stained with thiazole orange and anti-TER119 antibody to determine reticulocyte percentage. (I) Expression levels of erythropoietin (Epo) in adult kidney from Klf3+/+ (n = 3), Klf3+/− (n = 2), and Klf3−/− (n = 2) mice were determined by qRT-PCR. Relative expression was normalized against 18S rRNA and the expression level in Klf3+/− tissue was set to 1.0. (J) Plot showing the relative survival rate of WT (n = 3) and Klf3−/− (n = 3) erythrocytes tracked in vivo by biotin labeling. Error bars represent the standard errors of the means. P values indicate the differences between two means: *, P < 0.05; **, P < 0.01. WT, wild type (Klf3+/+); KO, knockout (Klf3−/−).
Fig 2
Fig 2
Abnormal splenic structure and erythropoiesis in Klf3−/− mice. (A) Klf3−/− spleens are larger than those of Klf3+/+ littermates (left). Klf3−/− mice are smaller than Klf3+/+ littermates (26), while normalized Klf3−/− spleen weights are significantly increased (right; n = 42 for each genotype). (B and C) Klf3−/− spleens have increased red pulp at the expense of white pulp. Shown are representative sections from analysis of four Klf3+/+ (left) and four Klf3−/− mice (right) stained with H&E at ×40 (B) and ×100 (C) magnification. Arrows indicate red pulp, and arrowheads show white pulp. (D) Increased prevalence of Howell-Jolly bodies (arrows) and reticulocytes (arrowheads) in the peripheral blood of Klf3−/− animals. Shown are representative smears (magnification, ×1,000) comparing Klf3+/+ (left) and Klf3−/− (right) peripheral blood samples from analysis of 6 mice of each genotype, 12 to 16 weeks old. Error bars show the standard errors of the means. P values indicate the differences between two means: **, P < 0.01. WT, wild type (Klf3+/+); KO, knockout (Klf3−/−).
Fig 3
Fig 3
Disrupted erythropoiesis in the spleen, bone marrow, and fetal liver of Klf3−/− mice. Representative flow cytometry plots of Klf3+/+ and Klf3−/− cells stained with antibodies against CD71 and TER119 are shown. Klf3+/+ (left) and Klf3−/− (center) cells were purified from spleen (A) and bone marrow (B) of 8- to 13-week-old adults and from E16.5 fetal liver (C). (Right) Statistical analyses of flow cytometry data from several animals (spleen, n = 10 for each genotype; bone marrow, n = 12 for each genotype; fetal liver, n = 5 for each genotype). Error bars show standard errors of the means. P values indicate the differences between two means: *, P < 0.05; **, P < 0.01. WT, wild type (Klf3+/+); KO, knockout (Klf3−/−).
Fig 4
Fig 4
Klf3 expression increases during erythroid maturation. Expression levels of Klf3 were examined by real-time qRT-PCR in sorted TER119 and TER119+ wild-type erythrocytes from E14.5 fetal liver. Shown are relative expression levels for total Klf3 mRNA and also for transcripts emanating from the widely active promoter 1a and the erythroid-cell-specific promoter 1b (8). Relative expression was normalized against 18S rRNA, and the expression level in TER119 cells was set to 1.0. For TER119 cells, n = 4; for TER119+ cells, n = 2 or 3. Error bars show standard errors of the means. P values indicate the differences between two means: **, P < 0.01; ***, P < 0.001 (two-tailed t test).
Fig 5
Fig 5
KLF3 represses many genes in maturing TER119+ erythroblasts. RNA was extracted from TER119 (four Klf3+/+ and four Klf3−/−) and TER119+ (four Klf3+/+and three Klf3−/−) sorted cell populations from E14.5 fetal liver and was subjected to Affymetrix microarray analysis. (A) Volcano plot comparing gene expression in TER119+ Klf3+/+ and Klf3−/− cells. Data are for genes which are significantly differentially expressed (i.e., more than a 2-fold change) (P < 0.05; FDR < 0.2). Red dots represent genes that are derepressed in Klf3−/− cells, while blue dots represent genes that are downregulated. (B) Heat map comparing gene expression in TER119 and TER119+ Klf3+/+ and Klf3−/− sorted erythroid cells. Heat maps represent the hierarchical clustering of the set of genes that are significantly differentially expressed (as shown in panel A). Deregulated genes can broadly be grouped into three categories based on their expression during erythroid maturation: genes that are mildly repressed or stable (set 1), upregulated (set 2), or strongly repressed or silenced (set 3) in TER119+ compared to TER119 wild-type cells. WT, wild type (Klf3+/+); KO, knockout (Klf3−/−).
Fig 6
Fig 6
Increased repression of the KLF3 target gene Klf8 during erythroid maturation. Shown are relative Klf8 expression levels in Klf3+/+ and Klf3−/− TER119 cells and in Klf3+/+, Klf3+/− and Klf3−/− TER119+ cells. Relative expression was normalized against 18S rRNA, and the expression level in Klf3+/+ TER119+ cells was set to 1.0. For TER119 cells, n = 3; for TER119+ cells, n = 2 or 3. Error bars show standard errors of the means. WT, wild type (Klf3+/+); KO, knockout (Klf3−/−).
Fig 7
Fig 7
KLF3 and EKLF regulate shared target genes. Expression of Lgals3 (A) and Fam132a (C) increases upon tamoxifen (4-OHT)-induced rescue of EKLF in the Eklf-null cell line B1.6 by real-time qRT-PCR. Relative expression was normalized against 18S rRNA, and the expression level in uninduced cells was set to 1.0 (n = 3 for Lgals3 and 4 for Fam132a). Relative Lgals3 (B) and Fam132a (D) expression levels in Klf3+/+ (n = 4) and Klf3−/− (n = 3) TER119 cells and in Klf3+/+ (n = 2 or 3), Klf3+/− (n = 3) and Klf3−/− (n = 3) TER119+ cells. Relative expression was normalized against 18S rRNA, and the expression level in Klf3+/+ TER119+ cells was set to 1.0. (E) Chromatin immunoprecipitation assay showing binding of KLF3 at the Lgals3 and Fam132a loci. The ChIP assays were carried out in duplicate in Klf3-null murine embryonic fibroblasts into which a V5-tagged Klf3 transgene had been introduced. Fold enrichment was determined by real-time PCR and is relative to input signal. The enrichment at a site in the Klf8 locus where KLF3 has been reported to not bind (5) was set to 1.0. Klf8 promoter 1a was included as a positive control. Error bars show standard errors of the means. WT, wild type (Klf3+/+); KO, knockout (Klf3−/−).
Fig 8
Fig 8
EKLF drives KLF3 expression to repress nonerythroid genes during erythrocyte maturation. This model proposes that EKLF drives high-level expression of KLF3 in TER119+ erythroblasts both to silence nonerythroid CACCC box genes and to fine-tune the expression of a subset of EKLF erythroid targets. By this mechanism, KLF3 ensures that during red blood cell maturation, essential erythroid genes are expressed at optimal levels, while those that are not required remain silent.

Similar articles

Cited by

References

    1. Borg J, et al. 2010. Haploinsufficiency for the erythroid transcription factor KLF1 causes hereditary persistence of fetal hemoglobin. Nat. Genet. 42:801–805 - PMC - PubMed
    1. Coghill E, et al. 2001. Erythroid Kruppel-like factor (EKLF) coordinates erythroid cell proliferation and hemoglobinization in cell lines derived from EKLF null mice. Blood 97:1861–1868 - PubMed
    1. Crossley M, et al. 1996. Isolation and characterization of the cDNA encoding BKLF/TEF-2, a major CACCC-box-binding protein in erythroid cells and selected other cells. Mol. Cell. Biol. 16:1695–1705 - PMC - PubMed
    1. Drissen R, et al. 2005. The erythroid phenotype of EKLF-null mice: defects in hemoglobin metabolism and membrane stability. Mol. Cell. Biol. 25:5205–5214 - PMC - PubMed
    1. Eaton SA, et al. 2008. A network of Kruppel-like factors (Klfs): Klf8 is repressed by Klf3 and activated by Klf1 in vivo. J. Biol. Chem. 283:26937–26947 - PMC - PubMed

Publication types

Substances