. 2012 Jan 1;20(4-5):515-545.
doi: 10.1080/13506285.2012.666577. Epub 2012 May 23.

TAM: Explaining off-object fixations and central fixation tendencies as effects of population averaging during search

Affiliations

TAM: Explaining off-object fixations and central fixation tendencies as effects of population averaging during search

Gregory J Zelinsky. Vis cogn. .

Abstract

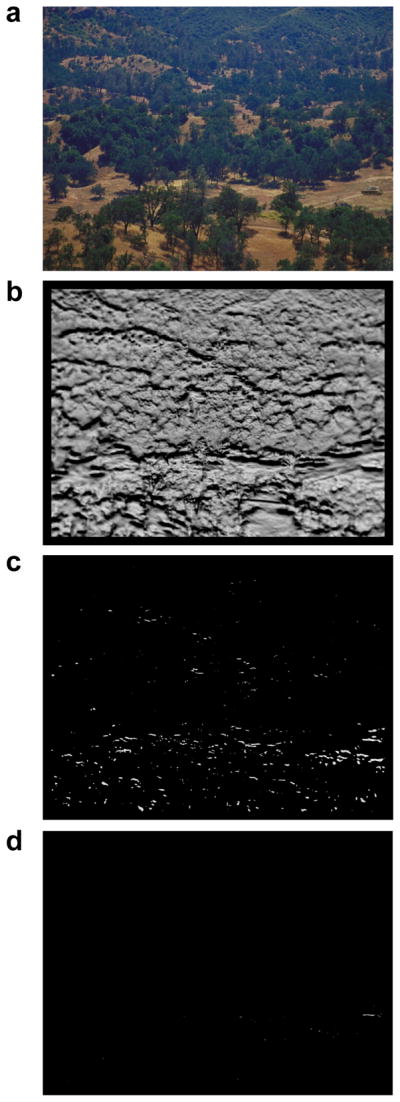
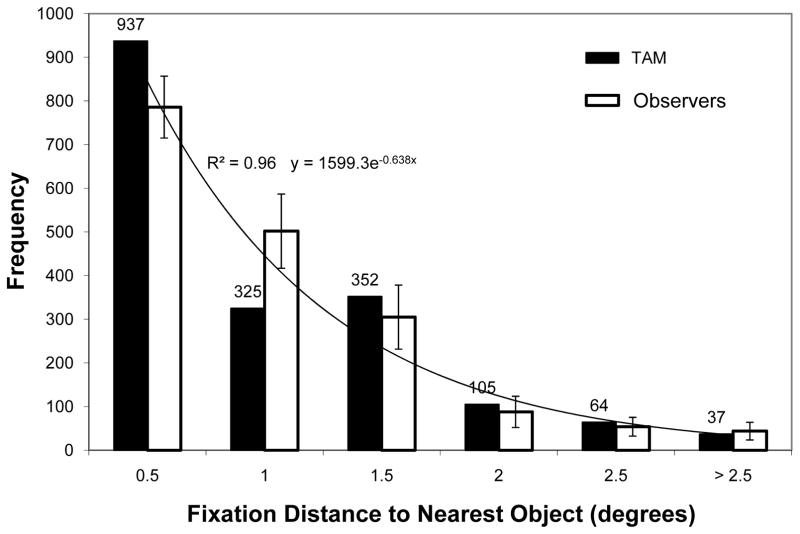
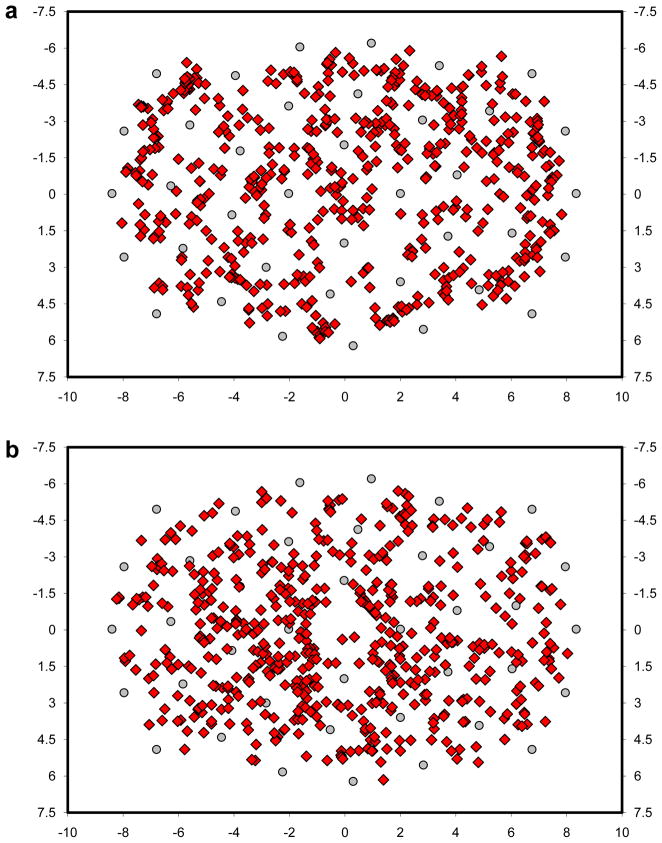
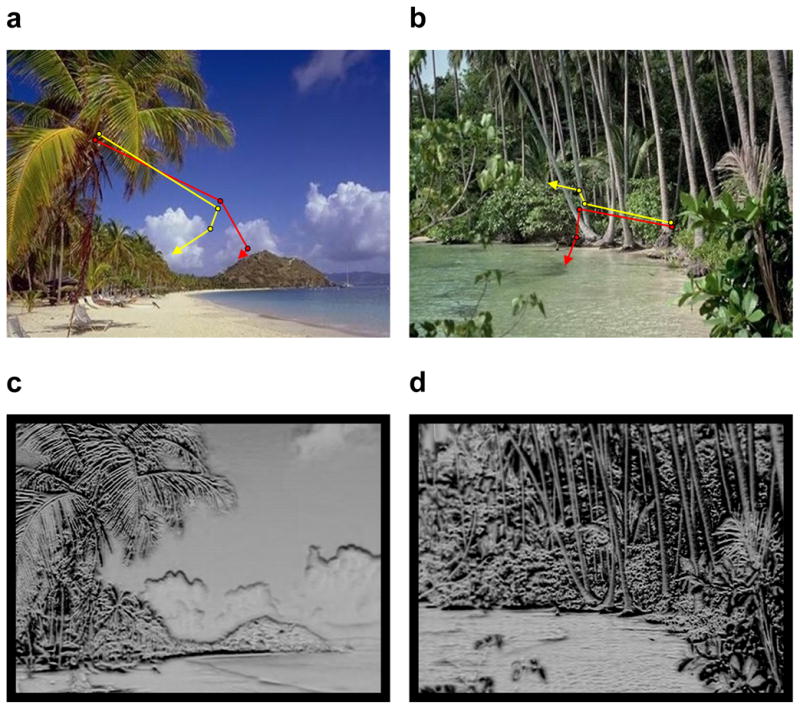
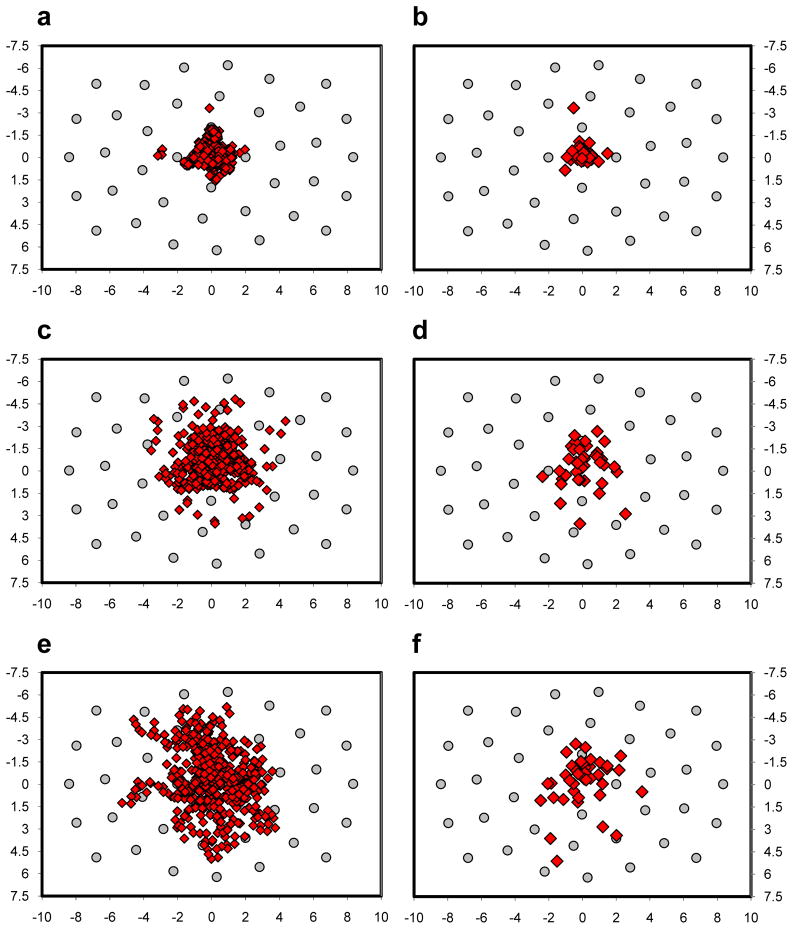
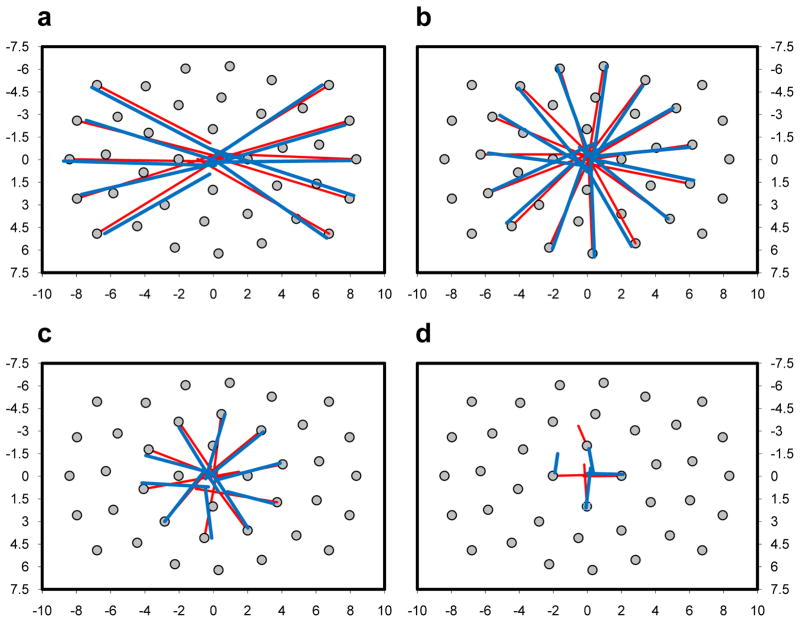
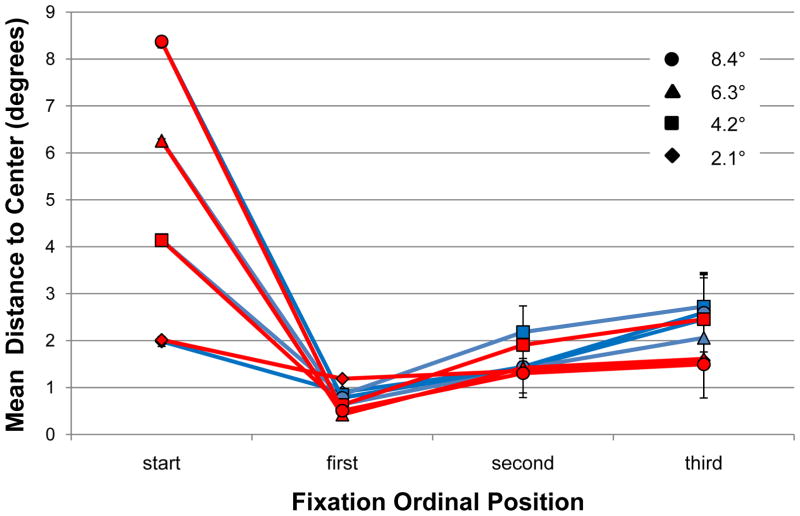
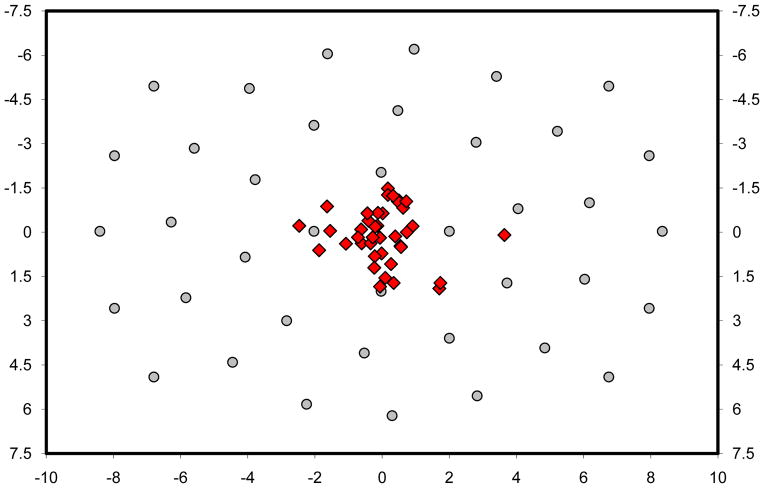
Understanding how patterns are selected for both recognition and action, in the form of an eye movement, is essential to understanding the mechanisms of visual search. It is argued that selecting a pattern for fixation is time consuming-requiring the pruning of a population of possible saccade vectors to isolate the specific movement to the potential target. To support this position, two experiments are reported showing evidence for off-object fixations, where fixations land between objects rather than directly on objects, and central fixations, where initial saccades land near the center of scenes. Both behaviors were modeled successfully using TAM (Target Acquisition Model; Zelinsky, 2008). TAM interprets these behaviors as expressions of population averaging occurring at different times during saccade target selection. A large population early during search results in the averaging of the entire scene and a central fixation; a smaller population later during search results in averaging between groups of objects and off-object fixations.


Figures

Figure 1
Figure 1
A search scene (a, target in middle right) and three target maps generated by TAM (b–d). (b) Early during target selection the population of potential saccade vectors covers most of the scene. (c) An intermediate stage in saccade target selection after vectors to unlikely target locations have been pruned from the target map. (d) A late stage in saccade target selection showing only vectors to the target on the target map. Figure adapted from Zelinsky (2008).
Figure 2
Figure 2
A histogram of distances between each fixation made during search and the nearest search object, for both human observers (white) and TAM (black). Error bars indicate the 95% confidence interval with respect to the behavioral mean.
Figure 3
Figure 3
Scatterplots showing search fixations greater than 1.0° from an object for (a) a representative observer, and (b) TAM. Possible object locations are indicated by the gray circle markers, and axes are in degrees of visual angle relative to center. Note that fixations appearing closer than 1.0° from an object marker are not errors; these fixations are from trials in which no object occupied that location.
Figure 4
Figure 4
(a, b) Representative scenes used in Experiment 2. The first three eye movements during search are shown for TAM (red) and an observer (yellow). (c, d) Corresponding target maps from TAM, each based on the starting gaze position.
Figure 5
Figure 5
Scatterplots of fixations following search scene onset for observers (left) and TAM (right). Grey circle markers indicate starting gaze positions, and axes are in degrees of visual angle relative to center. (a, b) First fixations. (c, d) Second fixations. (e, f) Third fixations.
Figure 6
Figure 6
Initial saccades originating from each of the 39 starting gaze positions (grey circle markers) for one observer (blue lines) and TAM (red lines). (a) Saccades from 8.4° eccentric locations, relative to center. (b) Saccades from 6.3° locations. (c) Saccades from 4.2° locations. (d) Saccades from 2.1° locations.
Figure 7
Figure 7
Mean distance in degrees between fixation and the center of the scenes as a function of fixation ordinal position and starting gaze position for observers (blue) and TAM (red). Error bars indicate 95% confidence intervals.
Figure 8
Figure 8
Scatterplot of positions obtained by finding the weighted centroid of points on a saliency map computed for each of the 39 target absent scenes used in Experiment 2. Axes are in degrees of visual angle relative to center.

References

    1. Abrams RA, Meyer DE, Kornblum S. Speed and accuracy of saccadic eye movements: Characteristics of impulse variability in the oculomotor system. Journal of Experimental Psychology: Human Perception and Performance. 1989;15:529–543. - PubMed
    1. Anderson RW, Keller EL, Gandhi NJ, Das S. Two-dimensional saccade-related population activity in the superior colliculus in monkey. Journal of Neurophysiology. 1998;80:798–817. - PubMed
    1. Allport DA. Selection for action: Some behavioural and neuro-physiological considerations of attention and action. In: Heuer H, Sanders AF, editors. Perspectives on perception and action. Hillsdale, NJ: Lawrence Erlbaum Associates Inc; 1987. pp. 395–419.
    1. Bonitz VS, Gordon RD. Attention to smoking-related and incongruous objects during scene viewing. Acta Psychologica. 2008;129:255–263. - PMC - PubMed
    1. Broadbent DE. Perception and Communication. London: Pergamon Press; 1958.

LinkOut - more resources