β-empirical Bayes inference and model diagnosis of microarray data
- PMID: 22713095
- PMCID: PMC3464654
- DOI: 10.1186/1471-2105-13-135
β-empirical Bayes inference and model diagnosis of microarray data
Abstract
Background: Microarray data enables the high-throughput survey of mRNA expression profiles at the genomic level; however, he data presents a challenging statistical problem because of the large number of transcripts with small sample sizes that are obtained. To reduce the dimensionality, various Bayesian or empirical Bayes hierarchical models have been developed. However, because of the complexity of the microarray data, no model can explain the data fully. It is generally difficult to scrutinize the irregular patterns of expression that are not expected by the usual statistical gene by gene models.
Results: As an extension of empirical Bayes (EB) procedures, we have developed the β-empirical Bayes (β-EB) approach based on a β-likelihood measure which can be regarded as an 'evidence-based' weighted (quasi-) likelihood inference. The weight of a transcript t is described as a power function of its likelihood, fβ(yt|θ). Genes with low likelihoods have unexpected expression patterns and low weights. By assigning low weights to outliers, the inference becomes robust. The value of β, which controls the balance between the robustness and efficiency, is selected by maximizing the predictive β₀-likelihood by cross-validation. The proposed β-EB approach identified six significant (p<10⁻⁵) contaminated transcripts as differentially expressed (DE) in normal/tumor tissues from the head and neck of cancer patients. These six genes were all confirmed to be related to cancer; they were not identified as DE genes by the classical EB approach. When applied to the eQTL analysis of Arabidopsis thaliana, the proposed β-EB approach identified some potential master regulators that were missed by the EB approach.
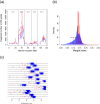
Conclusions: The simulation data and real gene expression data showed that the proposed β-EB method was robust against outliers. The distribution of the weights was used to scrutinize the irregular patterns of expression and diagnose the model statistically. When β-weights outside the range of the predicted distribution were observed, a detailed inspection of the data was carried out. The β-weights described here can be applied to other likelihood-based statistical models for diagnosis, and may serve as a useful tool for transcriptome and proteome studies.
Figures


Similar articles
-
Weighted lasso in graphical Gaussian modeling for large gene network estimation based on microarray data.Genome Inform. 2007;19:142-53. Genome Inform. 2007. PMID: 18546512
-
Prior robust empirical Bayes inference for large-scale data by conditioning on rank with application to microarray data.Biostatistics. 2014 Jan;15(1):60-73. doi: 10.1093/biostatistics/kxt026. Epub 2013 Aug 8. Biostatistics. 2014. PMID: 23934072 Free PMC article.
-
Intensity-based hierarchical Bayes method improves testing for differentially expressed genes in microarray experiments.BMC Bioinformatics. 2006 Dec 19;7:538. doi: 10.1186/1471-2105-7-538. BMC Bioinformatics. 2006. PMID: 17177995 Free PMC article.
-
A Bayesian method for analysing spotted microarray data.Brief Bioinform. 2005 Dec;6(4):318-30. doi: 10.1093/bib/6.4.318. Brief Bioinform. 2005. PMID: 16420731 Review.
-
Model-averaged Bayesian t tests.Psychon Bull Rev. 2025 Jun;32(3):1007-1031. doi: 10.3758/s13423-024-02590-5. Epub 2024 Nov 7. Psychon Bull Rev. 2025. PMID: 39511109 Free PMC article. Review.
Cited by
-
Robust Significance Analysis of Microarrays by Minimum β-Divergence Method.Biomed Res Int. 2017;2017:5310198. doi: 10.1155/2017/5310198. Epub 2017 Jul 27. Biomed Res Int. 2017. PMID: 28819626 Free PMC article.
-
A 19-Gene expression signature as a predictor of survival in colorectal cancer.BMC Med Genomics. 2016 Sep 8;9(1):58. doi: 10.1186/s12920-016-0218-1. BMC Med Genomics. 2016. PMID: 27609023 Free PMC article.
-
A Hybrid One-Way ANOVA Approach for the Robust and Efficient Estimation of Differential Gene Expression with Multiple Patterns.PLoS One. 2015 Sep 28;10(9):e0138810. doi: 10.1371/journal.pone.0138810. eCollection 2015. PLoS One. 2015. PMID: 26413858 Free PMC article.
-
Robust volcano plot: identification of differential metabolites in the presence of outliers.BMC Bioinformatics. 2018 Apr 11;19(1):128. doi: 10.1186/s12859-018-2117-2. BMC Bioinformatics. 2018. PMID: 29642836 Free PMC article.
-
Robustification of Naïve Bayes Classifier and Its Application for Microarray Gene Expression Data Analysis.Biomed Res Int. 2017;2017:3020627. doi: 10.1155/2017/3020627. Epub 2017 Aug 7. Biomed Res Int. 2017. PMID: 28848763 Free PMC article.
References
Publication types
MeSH terms
LinkOut - more resources
Full Text Sources
Research Materials

