

Towards quantitative metagenomics of wild viruses and other ultra-low concentration DNA samples: a rigorous assessment and optimization of the linker amplification method
- PMID: 22713159
- PMCID: PMC3466414
- DOI: 10.1111/j.1462-2920.2012.02791.x
Towards quantitative metagenomics of wild viruses and other ultra-low concentration DNA samples: a rigorous assessment and optimization of the linker amplification method
Abstract
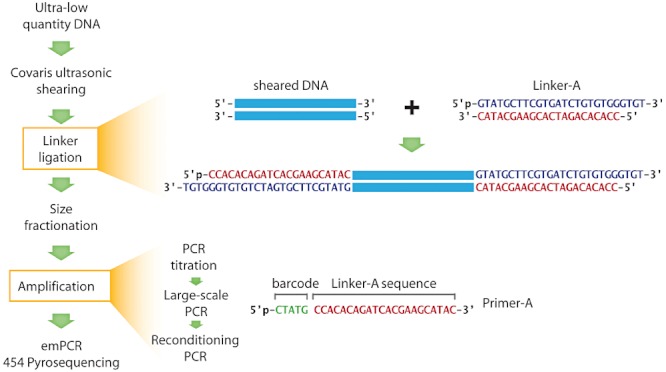
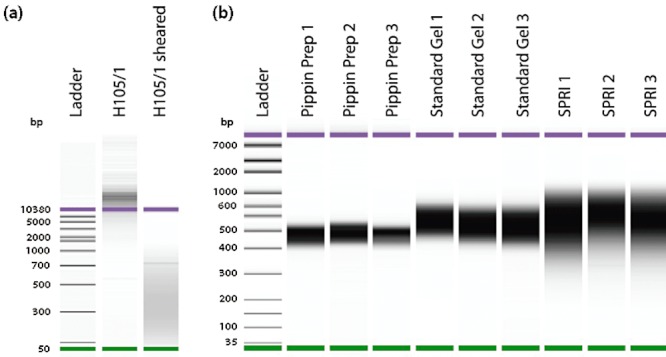
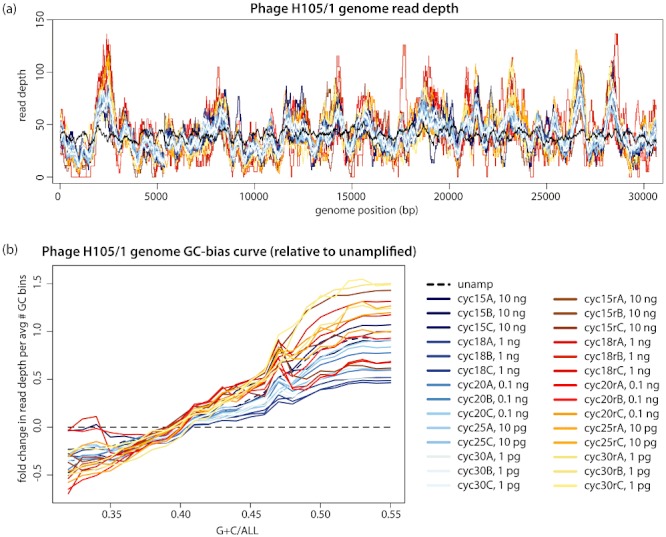
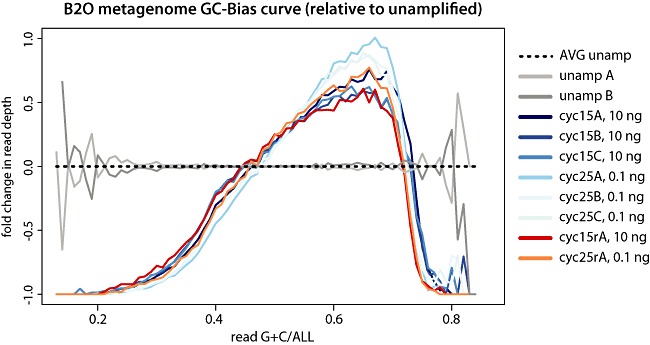
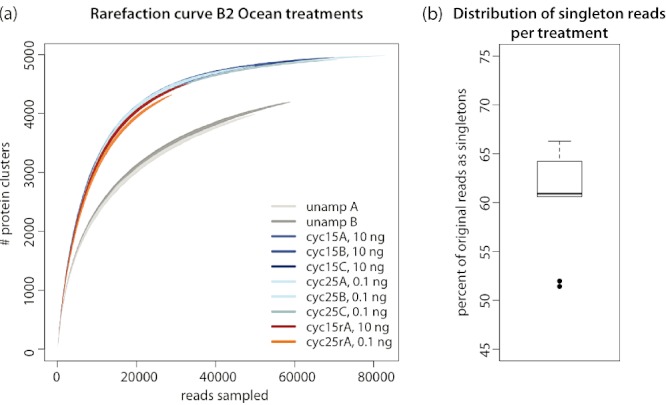
Metagenomics generates and tests hypotheses about dynamics and mechanistic drivers in wild populations, yet commonly suffers from insufficient (< 1 ng) starting genomic material for sequencing. Current solutions for amplifying sufficient DNA for metagenomics analyses include linear amplification for deep sequencing (LADS), which requires more DNA than is normally available, linker-amplified shotgun libraries (LASLs), which is prohibitively low throughput, and whole-genome amplification, which is significantly biased and thus non-quantitative. Here, we adapt the LASL approach to next generation sequencing by offering an alternate polymerase for challenging samples, developing a more efficient sizing step, integrating a 'reconditioning PCR' step to increase yield and minimize late-cycle PCR artefacts, and empirically documenting the quantitative capability of the optimized method with both laboratory isolate and wild community viral DNA. Our optimized linker amplification method requires as little as 1 pg of DNA and is the most precise and accurate available, with G + C content amplification biases less than 1.5-fold, even for complex samples as diverse as a wild virus community. While optimized here for 454 sequencing, this linker amplification method can be used to prepare metagenomics libraries for sequencing with next-generation platforms, including Illumina and Ion Torrent, the first of which we tested and present data for here.
© 2012 Society for Applied Microbiology and Blackwell Publishing Ltd.
Figures
References
-
- Altschul SF, Gish W, Miller W, Myers EW, Lipman DJ. Basic local alignment search tool. J Mol Biol. 1990;215:403–410. - PubMed
-
- Arriola E, Lambros MB, Jones C, Dexter T, Mackay A, Tan DS. Evaluation of Phi29-based whole-genome amplification for microarray-based comparative genomic hybridisation. Lab Invest. 2007;87:75–83. - PubMed
-
- Avrani S, Wurtzel O, Sharon I, Sorek R, Lindell D. Genomic island variability facilitates Prochlorococcus-virus coexistence. Nature. 2011;474:604–608. - PubMed
Publication types
MeSH terms
LinkOut - more resources
Full Text Sources
Other Literature Sources
