. 2012 Jun 6;102(11):2433-42.
doi: 10.1016/j.bpj.2012.05.001. Epub 2012 Jun 5.

Criticality in intracellular calcium signaling in cardiac myocytes

Affiliations

Criticality in intracellular calcium signaling in cardiac myocytes

Michael Nivala et al. Biophys J. .

Abstract

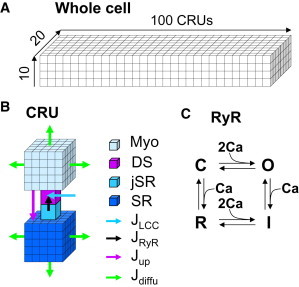
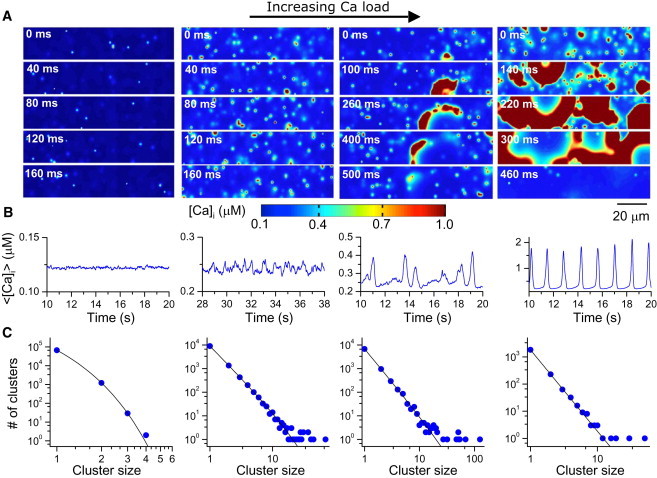
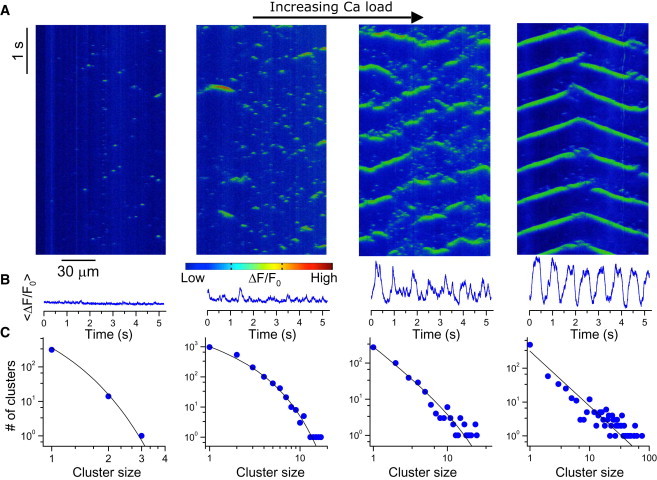
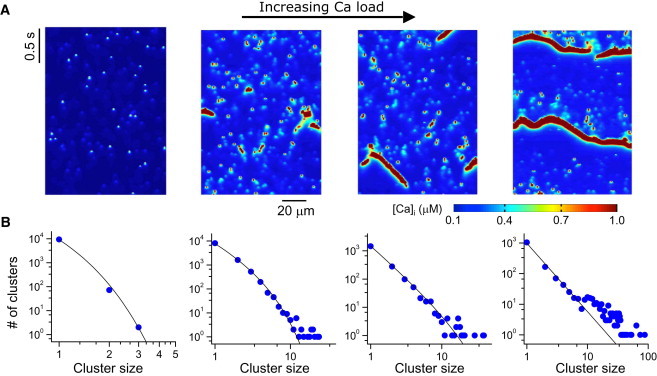
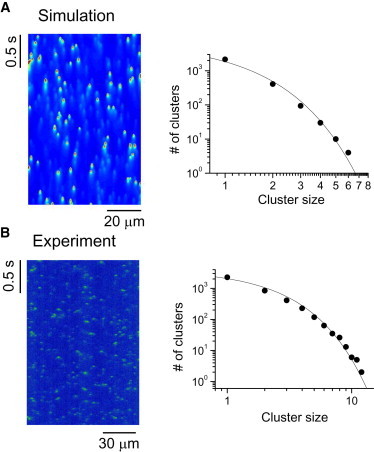
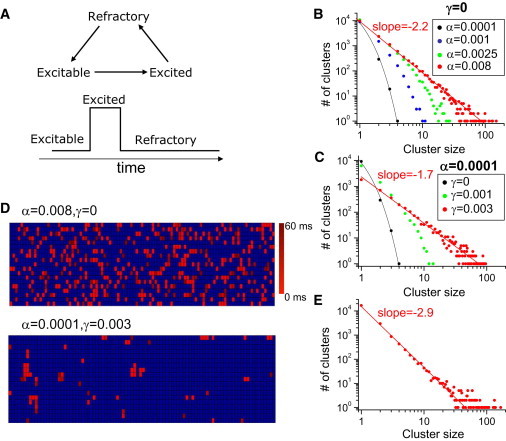
Calcium (Ca) is a ubiquitous second messenger that regulates many biological functions. The elementary events of local Ca signaling are Ca sparks, which occur randomly in time and space, and integrate to produce global signaling events such as intra- and intercellular Ca waves and whole-cell Ca oscillations. Despite extensive experimental characterization in many systems, the transition from local random to global synchronous events is still poorly understood. Here we show that criticality, a ubiquitous dynamical phenomenon in nature, is responsible for the transition from local to global Ca signaling. We demonstrate this first in a computational model of Ca signaling in a cardiac myocyte and then experimentally in mouse ventricular myocytes, complemented by a theoretical agent-based model to delineate the underlying dynamics. We show that the interaction between the Ca release units via Ca-induced Ca release causes self-organization of Ca spark clusters. When the coupling between Ca release units is weak, the cluster-size distribution is exponential. As the interactions become strong, the cluster-size distribution changes to a power-law distribution, which is characteristic of criticality in thermodynamic and complex nonlinear systems, and facilitates the formation and propagation of Ca waves and whole-cell Ca oscillations. Our findings illustrate how criticality is harnessed by a biological cell to regulate Ca signaling via self-organization of random subcellular events into cellular-scale oscillations, and provide a general theoretical framework for the transition from local Ca signaling to global Ca signaling in biological cells.


Figures

Figure 1
Figure 1
Schematic diagrams of the computer model. (A) A CRU network representing a cardiac myocyte. (B) Detailed structure of a computational CRU. (C) The four-state RyR model.
Figure 2
Figure 2
Ca signaling hierarchy and cluster-size distribution in a model of ventricular myocytes. (A) Snapshots of Ca concentration in the cytoplasmic space for different Ca loads achieved by altering extracellular [Ca]o. From left to right, [Ca]o = 3 mM, 9 mM, 10 mM, and 16 mM. (B) Averaged whole-cell Ca concentration for the corresponding loading condition. (C) Number of clusters versus spark cluster size. Symbols are data from simulations and lines are reference lines. The line in the leftmost panel is a pure exponential.
Figure 3
Figure 3
Ca signaling hierarchy and cluster-size distribution in permeabilized mouse ventricular myocytes. (A) Space-time plot of Fluo-4 intensity for bathing free Ca concentrations of 100 nM, 300 nM, 400 nM, and 500 nM from left to right. (B) Averaged whole-cell Ca concentration for the corresponding Ca loads. (C) Cluster-size distributions for the corresponding Ca loads. Symbols are data from experiments and lines are reference lines. The line in the leftmost panel in C is a pure exponential.
Figure 4
Figure 4
Cluster-size distribution obtained using line scans from the computer simulations. (A) Space-time plots of Ca concentration along a line through the ventricular myocyte model (see corresponding simulations in Fig. 2). (B) Cluster-size distributions obtained using the line scan data from the corresponding simulations. Symbols are data from simulations and lines are reference lines. The line in the leftmost panel in B is a pure exponential.
Figure 5
Figure 5
High intracellular Ca buffering changes a power-law distribution to an exponential distribution. (A) Space-time plot of Ca concentration in a computer simulation with a fivefold higher concentration of Ca buffer, for [Ca]o = 10 mM and the corresponding cluster-size distribution obtained from the line scan data, showing an exponential distribution (the plotted reference line is a pure exponential function). (B) Space-time plot of ΔF/F0 from a mouse ventricular myocyte using 1 mM EGTA to buffer-free Ca at 400 nM, and the corresponding cluster-size distribution, showing an exponential distribution. The plotted reference line is a purely exponential function.
Figure 6
Figure 6
Spark dynamics in an agent-based model. (A) Schematics of the three-state model. (B) Cluster-size distributions for different α when the CRUs are uncoupled. (C) Cluster-size distribution for different γ-values with a small α. (D) Time-lapse images of 2D slices of the state spaces for the uncoupled (top) and coupled (bottom) systems over a time period equal to the spark duration, both at criticality. The color scale gives the initial time of the spark. (E) Cluster-size distribution when the nearest diagonal elements are coupled. The black lines in B and C are purely exponential.

References

    1. Berridge M.J., Bootman M.D., Lipp P. Calcium—a life and death signal. Nature. 1998;395:645–648. - PubMed
    1. Berridge M.J., Lipp P., Bootman M.D. The versatility and universality of calcium signalling. Nat. Rev. Mol. Cell Biol. 2000;1:11–21. - PubMed
    1. Bers D.M. Cardiac excitation-contraction coupling. Nature. 2002;415:198–205. - PubMed
    1. Clapham D.E. Calcium signaling. Cell. 2007;131:1047–1058. - PubMed
    1. Camacho P., Lechleiter J.D. Increased frequency of calcium waves in Xenopus laevis oocytes that express a calcium-ATPase. Science. 1993;260:226–229. - PubMed

Publication types