. 2012 Jun 6;102(11):2517-25.
doi: 10.1016/j.bpj.2012.04.022. Epub 2012 Jun 5.

Investigation of Ebola VP40 assembly and oligomerization in live cells using number and brightness analysis

Affiliations

Investigation of Ebola VP40 assembly and oligomerization in live cells using number and brightness analysis

Emmanuel Adu-Gyamfi et al. Biophys J. .

Abstract

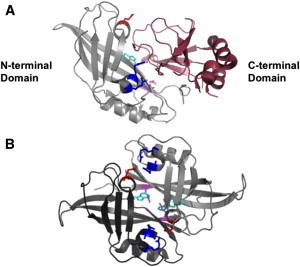
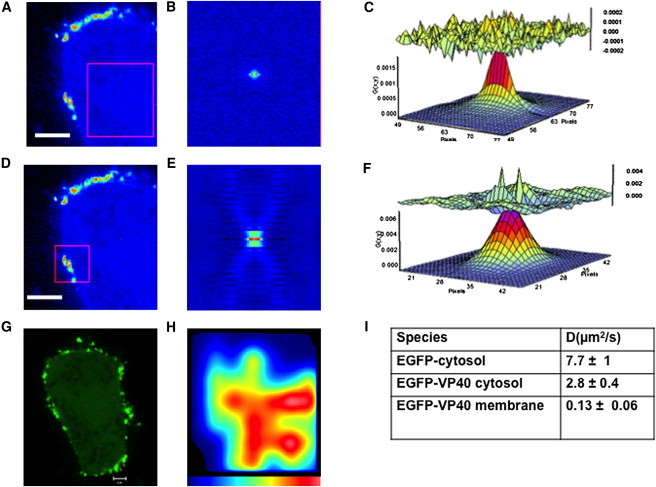
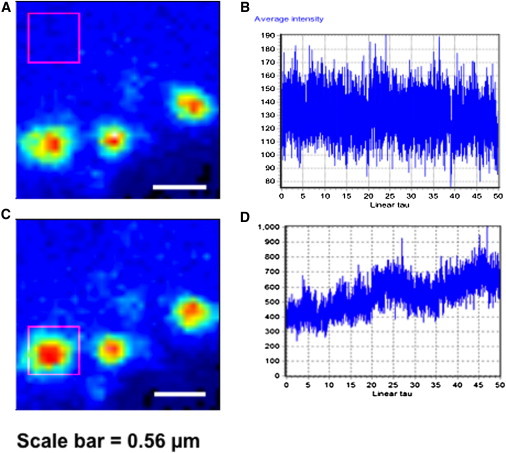
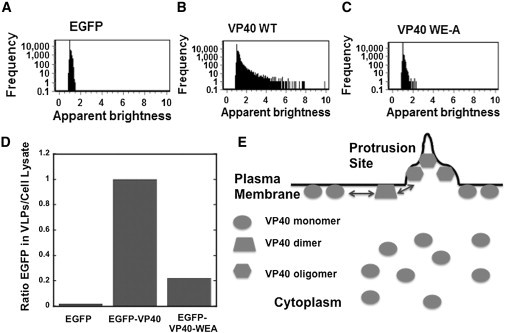
Ebola virus assembles and buds from the inner leaflet of the plasma membrane of mammalian cells, which is primarily attributed to its major matrix protein VP40. Oligomerization of VP40 has been shown to be essential to the life cycle of the virus including formation of virions from infected cells. To date, VP40 oligomerization has mainly been assessed by chemical cross-linking following cell fractionation studies with VP40 transfected cells. This has made it difficult to discern the spatial and temporal dynamics of VP40 oligomerization. To gain a better understanding of the VP40 assembly and oligomerization process in live cells, we have employed real-time imaging of enhanced green fluorescent protein tagged VP40. Here, we use both confocal and total internal reflection microscopy coupled with number and brightness analysis to show that VP40 oligomers are localized on the plasma membrane and are highly enriched at sites of membrane protrusion, consistent with sites of viral budding. These filamentous plasma membrane protrusion sites harbor VP40 hexamers, octamers, and higher order oligomers. Consistent with previous reports, abrogation of VP40 oligomerization through mutagenesis greatly diminished VP40 egress and also abolished membrane protrusion sites enriched with VP40. In sum, real-time single-molecule imaging of fluorescently labeled Ebola VP40 is able to resolve the spatial and temporal dynamics of VP40 oligomerization.


Figures

Figure 1
Figure 1
Structure of VP40 and VP40 intradimeric interface. VP40 consists of an N-terminal domain (gray) that has been shown to be involved in oligomerization and a C-terminal domain (raspberry) that has been deemed important for membrane binding. (A) VP40 x-ray structure (PDB: 1ES6) with the N-terminal domain and C-terminal domain colored in gray and raspberry, respectively. Purported residues involved in oligomerization are highlighted: Trp95 (cyan), Arg148 and Arg149 (blue), Glu160 (red), and Glu184 (magenta). (B) Antiparallel monomeric-monomeric interface (intradimeric interface with one monomer in dark gray and the second monomer in light gray) highlighting the Glu160 (red) interaction with Arg148 and Arg149 (blue), and the Trp95 (cyan) interaction with Glu184 (magenta) (PDB: 1H2D).
Figure 2
Figure 2
RICS analysis of EGFP-VP40 expressed in HEK293T cells. RICS data were acquired by taking 100 frames (256 × 256 pixels at 0.05 μm/pixel) at a scan speed of 12.60 μs/pixel. (A) A region of interest (White scale bar = 3.2 μm), 4.5 μm × 4.5 μm (pink square box) in the cytosol was analyzed to yield (B) the spatial autocorrelation map of the cytosol. (C) The spatial autocorrelation map is then fit to a single species diffusion model to determine the diffusion coefficient of VP40 in the cytosol (2.8 ± 0.4 μm2 s−1). (D) Region of interest (white scale bar = 3.2 μm) at the plasma membrane from the same cell shown in A is used to calculate (E) the spatial correlation map and (F) fit the spatial correlation map to a single species diffusion model to calculate the diffusion coefficient of VP40 at the plasma membrane (0.13 ± 0.06 μm2 s−1). (G) The same cell shown in A and D (visualized as EGFP localization) is used to create (H) a diffusion map of the VP40 transfected cell, where the color scale represents fast (red or darkest) or slow (blue or lightest) diffusion for the 4.5 μm × 4.5 μm area highlighted in A. Here, the area of interest is fit to a single species diffusion model to investigate the change in diffusion coefficient of EGFP-VP40 with respect to spatial localization. The fastest (or largest diffusion coefficients) moving particles are shown in red (darkest), whereas the slowest (smallest diffusion coefficients) are shown in blue (lightest). (I) The diffusion coefficients determined for EGFP, EGFP-VP40 in the cytosol, and EGFP-VP40 at the plasma membrane. VP40 exhibits 22-fold slower diffusion at the plasma membrane than in the cytosol.
Figure 3
Figure 3
Recruitment of VP40 to the plasma membrane. Analysis of cytosolic and membrane regions of HEK293T cells expressing EGFP-VP40 were done with RICS. (A) Average image of cell showing region of analysis in the cytosol (pink box). (B) Intensity derivative plot obtained by analysis of intensity fluctuations in the cytosol with respect to time. The total scan time was 156 s and thus the x axis represents a total time of 156 s where linear tau represents time with 1 unit representing 3.12 s. (C) Average image showing region of interest at a plasma membrane VP40 bud site where three individual growing bud sites are shown. (D) Intensity plot with respect to time at the membrane. The total scan time was 156 s and thus the x axis represents a total time of 156 s where linear tau represents time with 1 unit representing 3.12 s.
Figure 4
Figure 4
Brightness analysis of VP40 and EGFP in HEK293T cells. (A) TIRF intensity image of a HEK293T cell transfected with plasmid expressing EGFP. (B) Brightness image of the same cell shows the lack of EGFP clustering. (C) Brightness versus intensity map for the EGFP expressing cell with monomers highlighted by the red box. (D) Selected pixels from C displaying the localization of monomeric EGFP in red. (E) TIRF intensity image of a HEK293T cell expressing EGFP-VP40. (F) Brightness distribution of the VP40 expressing cell in E demonstrates enrichment of EGFP-VP40 clustering on the plasma membrane. Specifically, EGFP-VP40 is clustered at sites of membrane protrusion that can also be viewed in Fig. S3. (G) Brightness versus intensity map of VP40 showing monomers (red box or lower box), trimers (blue box or middle box), and octamers (green box or upper box). (H) Selected pixels from G showing monomers (red), trimers (blue), and octamers (green). The majority of VP40 localized to the plasma membrane is present in the monomeric form. (I) Brightness versus intensity plot displaying hexamers (red box or lower box) and octamers (blue box or upper box). (J) Brightness distribution of VP40 with selected pixels displaying hexamers (red) and octamers (blue), which are significantly enriched at sites of membrane protrusions. (K) Brightness versus intensity plot displaying 16 mers (red box). (L) Image of the cell showing pixels with brightness of 16 mers (red) localized at sites of membrane protrusion. White scale bar = 18 μm on all panels.
Figure 5
Figure 5
Correlation of VP40 and VP40-WEA apparent brightness and frequency as well as VLP egress. (A) Frequency versus apparent brightness plot for monomeric EGFP, (B) EGFP-VP40, and (C) EGFP-VP40 WE-A from HEK293T cells. These plots show the frequency (pixels) of VP40 oligomerization in comparison to VP40 WE-A. (D) VLPs were detected with anti-EGFP antibody to compare the release of EGFP-VP40 and EGFP-VP40-WEA VLPs. Cells transfected with EGFP were used as a control for background EGFP detection. Results are plotted as a ratio of EGFP in the VLPs/EGFP in the cell lysate. Three trials were run for each condition from two separate experiments of VLP and cell lysate collection. (E) A model proposing the localization of VP40 oligomers. Imaging data from both confocal and TIRF microscopy support the notion that VP40 is predominantly monomeric in the cytoplasm as well as when associated with the plasma membrane. Plasma membrane association of VP40 then may be able to induce the oligomerization of VP40 into dimers and trimers, which are also predominantly associated with the plasma membrane. Higher order VP40 oligomers (hexamers and octamers for instance), which have been shown to exist in infectious Ebola virions are highly enriched in membrane protrusions emanating from the plasma membrane. (See the Discussion section for a more critical discussion of the factors that may regulate VP40 assembly and oligomerization).

References

    1. Bowen E.T., Lloyd G., Vella E.E. Viral haemorrhagic fever in southern Sudan and northern Zaire. Preliminary studies on the aetiological agent. Lancet. 1977;1:571–573. - PubMed
    1. Elliott L.H., Kiley M.P., McCormick J.B. Descriptive analysis of Ebola virus proteins. Virology. 1985;147:169–176. - PubMed
    1. Johnson K.M., Lange J.V., Murphy F.A. Isolation and partial characterisation of a new virus causing acute haemorrhagic fever in Zaire. Lancet. 1977;1:569–571. - PubMed
    1. Ksiazek T.G., Rollin P.E., Peters C.J. Clinical virology of Ebola hemorrhagic fever (EHF): virus, virus antigen, and IgG and IgM antibody findings among EHF patients in Kikwit, Democratic Republic of the Congo, 1995. J. Infect. Dis. 1999;179(Suppl 1):S177–S187. - PubMed
    1. Sullivan N.J., Martin J.E., Nabel G.J. Correlates of protective immunity for Ebola vaccines: implications for regulatory approval by the animal rule. Nat. Rev. Microbiol. 2009;7:393–400. - PMC - PubMed

Publication types

Substances