. 2012 Jul;61(7):967-78.
doi: 10.1007/s00262-012-1282-9. Epub 2012 May 22.

Harmonization of the intracellular cytokine staining assay

Affiliations

Harmonization of the intracellular cytokine staining assay

Marij J P Welters et al. Cancer Immunol Immunother. 2012 Jul.

Abstract

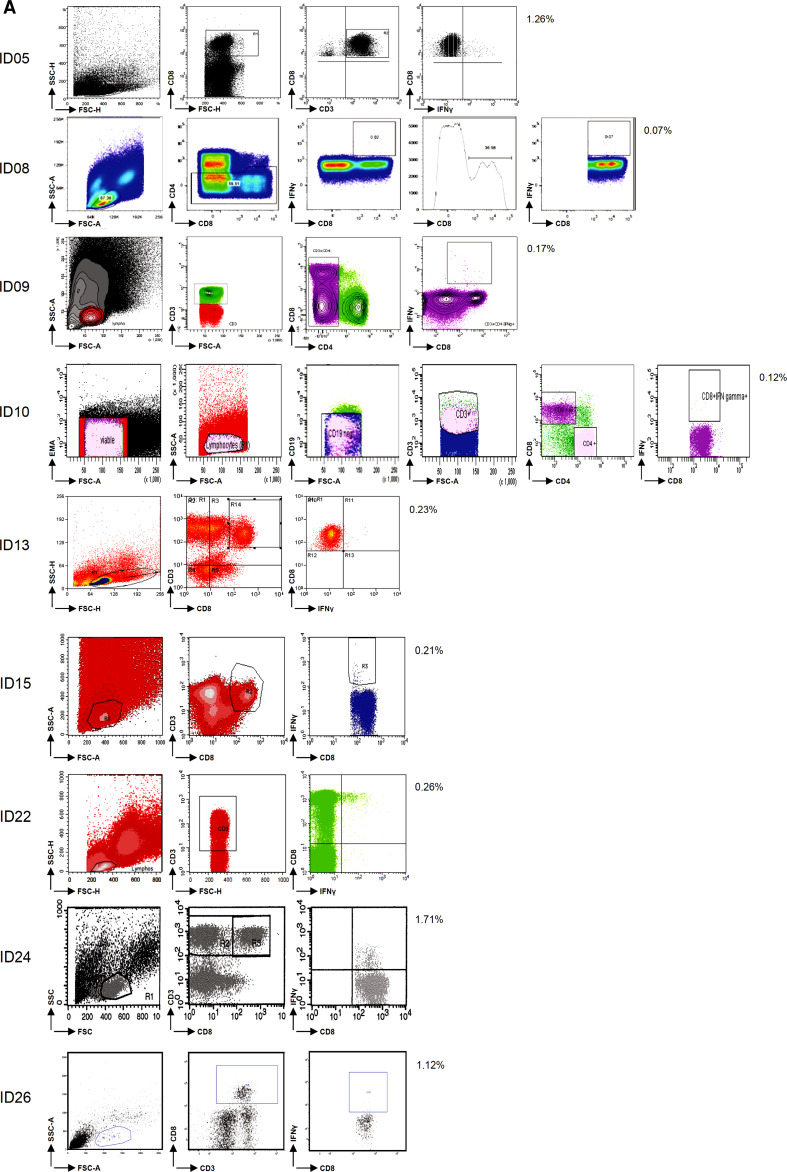
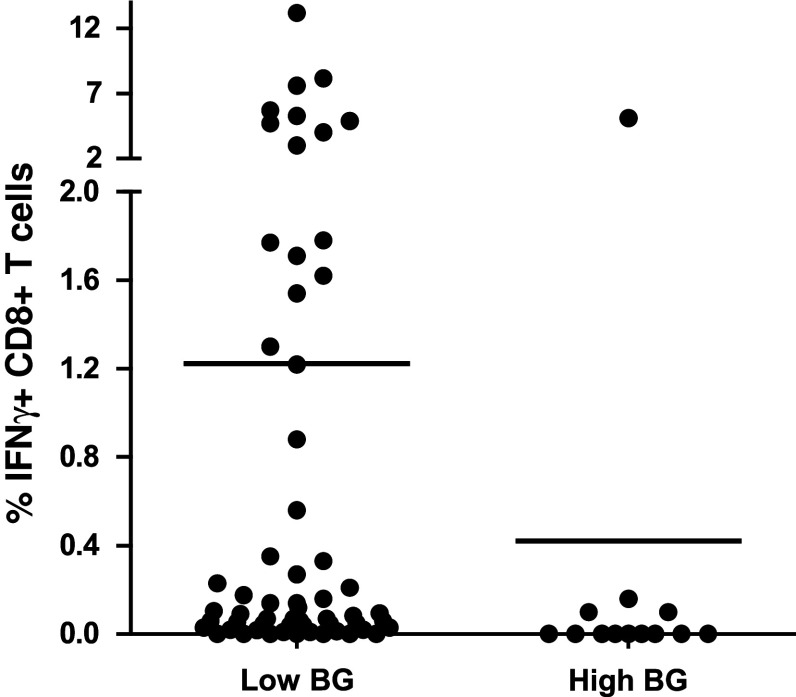
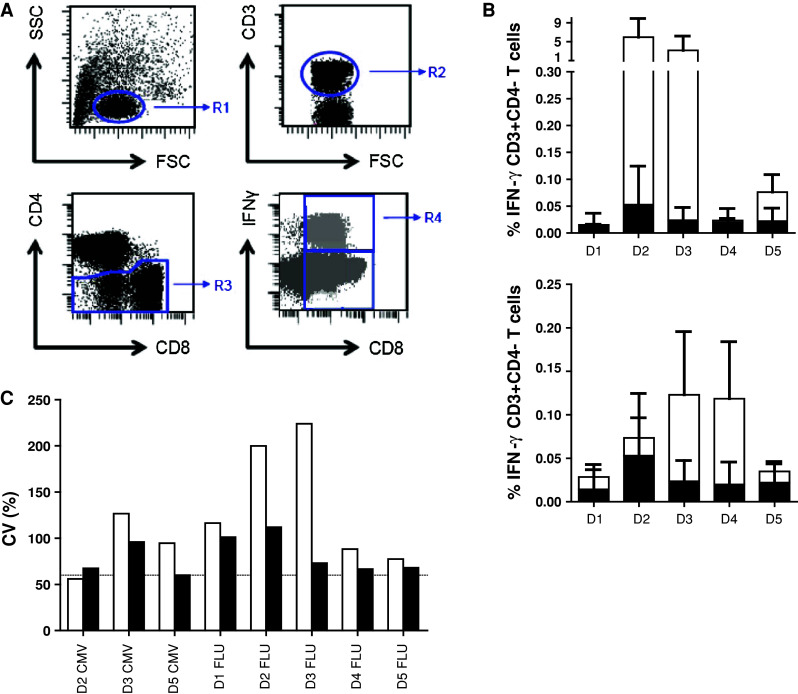
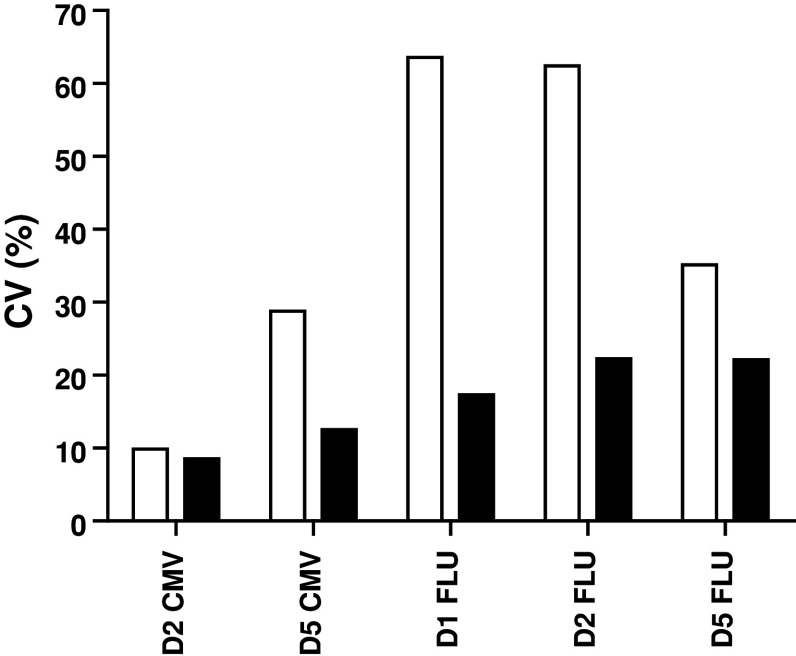
Active immunotherapy for cancer is an accepted treatment modality aiming to reinforce the T-cell response to cancer. T-cell reactivity is measured by various assays and used to guide the clinical development of immunotherapeutics. However, data obtained across different institutions may vary substantially making comparative conclusions difficult. The Cancer Immunotherapy Immunoguiding Program organizes proficiency panels to identify key parameters influencing the outcome of commonly used T-cell assays followed by harmonization. Our successes with IFNγ-ELISPOT and peptide HLA multimer analysis have led to the current study on intracellular cytokine staining (ICS). We report the results of three successive panels evaluating this assay. At the beginning, 3 out of 9 participants (33 %) were able to detect >6 out of 8 known virus-specific T-cell responses in peripheral blood of healthy individuals. This increased to 50 % of the laboratories in the second phase. The reported percentages of cytokine-producing T cells by the different laboratories were highly variable with coefficients of variation well over 60 %. Variability could partially be explained by protocol-related differences in background cytokine production leading to sub-optimal signal-to-noise ratios. The large number of protocol variables prohibited identification of prime guidelines to harmonize the assays. In addition, the gating strategy used to identify reactive T cells had a major impact on assay outcome. Subsequent harmonization of the gating strategy considerably reduced the variability within the group of participants. In conclusion, we propose that first basic guidelines should be applied for gating in ICS experiments before harmonizing assay protocol variables.


Conflict of interest statement

The authors declare that they have no conflict of interest.

Figures

Fig. 1
Fig. 1
Assay variables influencing the test performance in phase 1. a Analysis plots of the same sample (i.e., donor 3 tested for FLU) are shown for all 9 participants as indicated by ID number, demonstrating the variety in frequencies of IFNγ-producing CD8+ T cells and in the gating strategies used. b The average frequency (+SD; 9 laboratories) of IFNγ-producing CD8+ T cells is depicted for each donor (D) in the negative control samples (black bars) and after stimulation with the CMV (left) or FLU (right) peptides (white bars). c The frequency of IFNγ-producing CD8+ T cells after stimulation with CMV (left) or FLU (right) is plotted according to the use of IMDM (4 participants, white boxes) or other media (5 participants, gray boxes) in the ICS assay for all 5 donors (D). Shown are the median, interquartile range and SD. Significant differences as determined by Mann–Whitney test are depicted. d Examples of the gating strategy applied for the detection of the IFNγ-producing CD8+ T cells. Some participants did not analyze the whole IFNγ-producing population, but gated through the positive cell population
Fig. 1
Fig. 1
Assay variables influencing the test performance in phase 1. a Analysis plots of the same sample (i.e., donor 3 tested for FLU) are shown for all 9 participants as indicated by ID number, demonstrating the variety in frequencies of IFNγ-producing CD8+ T cells and in the gating strategies used. b The average frequency (+SD; 9 laboratories) of IFNγ-producing CD8+ T cells is depicted for each donor (D) in the negative control samples (black bars) and after stimulation with the CMV (left) or FLU (right) peptides (white bars). c The frequency of IFNγ-producing CD8+ T cells after stimulation with CMV (left) or FLU (right) is plotted according to the use of IMDM (4 participants, white boxes) or other media (5 participants, gray boxes) in the ICS assay for all 5 donors (D). Shown are the median, interquartile range and SD. Significant differences as determined by Mann–Whitney test are depicted. d Examples of the gating strategy applied for the detection of the IFNγ-producing CD8+ T cells. Some participants did not analyze the whole IFNγ-producing population, but gated through the positive cell population
Fig. 2
Fig. 2
High background staining decreased ability to detect responses in phase 1. The detection (i.e., frequency of IFNγ-producing specific CD8+ T cells after FLU or CMV peptide stimulation) is shown only for the positive donor–antigen combinations versus a low or high background in the corresponding negative control sample. The background was classified as low (n = 59) or high (n = 13) based on the average background value (0.118 %) measured in all negative control samples (n = 72) accumulated from all participants
Fig. 3
Fig. 3
Guidelines partially harmonized ICS performance in phase 2. a The gating instructions provided to the participants for the second-phase ICS proficiency panel. First, the lymphocytes are gated (R1), then the CD3 population (R2), followed by plotting CD4 versus CD8 to gate on the CD8 (including the CD8dim) cells (R3), which is called the CD3+ CD4− cell population, and finally the IFNγ-producing CD3+ CD4− T cells can be gated. b The average frequency (+SD) of IFNγ-producing CD3+ CD4− T cells is depicted for each donor (D) in the negative control samples (black bars) and after stimulation with the CMV (top) or FLU (bottom) peptide (white bars). c The CV values per donor (D)–antigen (CMV or FLU) combination are depicted for those 6 laboratories participating in both phases 1 (white bars) and 2 (black bars)
Fig. 4
Fig. 4
High background staining correlates with a low detection rate in phase 3. The % of IFNγ-producing cells in the negative control sample (i.e., background) versus the detection of a response in the corresponding stimulated sample is depicted for all donor–antigen combinations (and all participants) in which a positive response should have been detected (left; n = 50 stainings) or in the case that low-frequency responses (as observed against FLU; n = 30 stainings) should have been detected (right). The background was significantly lower in those donor–antigen combinations where a response was detected
Fig. 5
Fig. 5
Harmonization of the gating strategy results in acceptable low variation between laboratories participating in phase 3. The coefficient of variation (CV) value is given for the initial analysis of the in silico gating ICS panel (white bars) and after instruction of three participants, who then performed a re-analysis (black bars) only for the positive reactive donor (D)-antigen (CMV or FLU) combination. The CV values dropped after harmonization of the gating strategy

References

    1. Hanahan D, Weinberg RA. Hallmarks of cancer: the next generation. Cell. 2011;144:646–674. doi: 10.1016/j.cell.2011.02.013. - DOI - PubMed
    1. Galon J, Costes A, Sanchez-Cabo F, Kirilovsky Am Mlecnik B, Lagorce-Page C, Tosolini M, Camus M, Berger A, Wind Ph, Zinzindohoue F, Bruneval P, Cugnenc H, Trajanoski Z, Fridman WH, Page F. Type, density, and location of immune cells within human colorectal tumors predict clinical outcome. Science. 2006;313:1960–1964. doi: 10.1126/science.1129139. - DOI - PubMed
    1. Kantoff PW, Higano CS, Shore ND, Berger ER, Small EJ, Penson DF, Redfern CH, Ferrari AC, Dreicer R, Sims RB, Xu Y, Frohlich MW, Schellhammer PF, Ahmed T, Amin A, Arseneau J, Barth N, Bernstein G, Bracken B, Burch P, Caggiano V, Chin J, Chodak G, Chu F, Corman J, Curti B, Dawson N, Deeken JF, Dubernet T, Fishman M, Flanigan R, Gailani F, Garbo L, Gardner T, Gelmann E, George D, Godfrey T, Gomella L, Guerra M, Hall S, Hanson J, Israeli R, Jancis E, Jewett MAS, Kassabian V, Katz J, Klotz L, Koeneman K, Koh H, Kratzke R, Lance R, Lech J, Leichman L, Lemon R, Liang J, Libertino J, Lilly M, Malik I, Martin SE, McCaffrey J, McLeod D, McNeel D, Miles B, Murdock M, Nabhan C, Nemunaitis J, Notter D, Pantuck A, Perrotte P, Pessis D, Petrylak D, Polikoff J, Pommerville P, Ramanathan S, Rarick M, Richards J, Rifkin R, Rohatgi N, Rosenbluth R, Santucci R, Sayegh A, Seigne J, Shapira I, Shedhadeh N, Shepherd D, Sridhar S, Stephenson R, Teigland C, Thaker N, Vacirca J, Villa L, Vogelzang N, Wertheim M, Wolff JH, Wurzel R, Yang C, Young J. Sipuleucel-T immunotherapy for castration-resistant prostate cancer. N Engl J Med. 2010;363:411–422. doi: 10.1056/NEJMoa1001294. - DOI - PubMed
    1. Hodi FS, O’Day SJ, McDermott DF, Weber RW, Sosman JA, Haanen JB, Gonzalez R, Robert C, Schadendorf D, Hassel JC, Akerley W, van den Eertwegh AJM, Lutzky J, Lorigan P, Vaubel JM, Linette GP, Hogg D, Ottensmeier CH, Lebbe C, Peschel C, Quirt I, Clark JI, Wolchok JD, Weber JS, Tian J, Yellin MJ, Nichol GM, Hoos A, Urba WJ. Improved survival with Ipilimumab in patients with metastatic melanoma. N Engl J Med. 2010;363:711–723. doi: 10.1056/NEJMoa1003466. - DOI - PMC - PubMed
    1. Welters MJ, Kenter GG, de Vos van Steenwijk PJ, Löwik MJ, Berends-van der Meer DM, Essahsah F, Stynenbosch LF, Vloon AP, Ramwadhdoebe TH, Piersma SJ, van der Hulst JM, Valentijn AR, Fathers LM, Drijfhout JW, Franken KL, Oostendorp J, Fleuren GJ, Melief CJ, van der Burg SH. Success or failure of vaccination for HPV16-positive vulvar lesions correlates with kinetics and phenotype of induced T-cell responses. Proc Nat Acad Sci USA. 2010;107:11895–11899. doi: 10.1073/pnas.1006500107. - DOI - PMC - PubMed

Publication types